Market Breadth Composite Rank Update

The S&P 500 Index closed at a new all-time high on 10/28/21. Whenever an Index registers a new high, I always like to assess the market's internal condition to see if the troops are participating.
Let's review how the new all-time high compares to history as measured by a market breadth composite.
MARKET BREADTH COMPOSITE COMPONENTS
- Percentage of issues above the 10-day moving average
- Percentage of issues above the 50-day moving average
- Percentage of issues above the 200-day moving average
- Percentage Spread Between 21-Day Highs and Lows
- Percentage Spread Between 63-Day Highs and Lows
- Percentage Spread Between 252-Day Highs and Lows
The individual component values are summed and divided by six to arrive at a single composite value. Composite values can turn negative during corrections and bear markets as new lows overwhelm new highs in the spread calculation.
MARKET BREADTH COMPOSITE STUDY
I first identified every single all-time closing high in the S&P 500 Index since 1928. According to my calculation, there are 1,333 instances. I then ranked each breadth composite value on the day of the all-time closing high. Rankings range from 100 (strongest) to 0 (weakest). By ranking each all-time high, I can now make an apples-to-apple comparison throughout history.
I conducted the same study for the S&P 1500 with data starting in 1963.
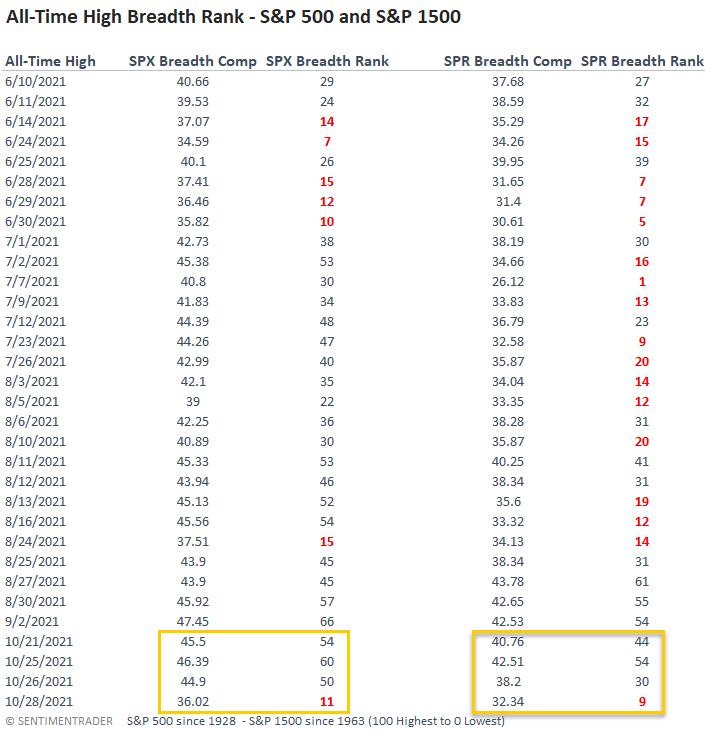
MARKET BREADTH COMPOSITE TABLE
Since my last update on 8/4/21, the S&P 500 has recorded 16 additional new all-time highs, with the most recent one occurring on Thursday, 10/28/21. I would classify the S&P 500 new high breadth rankings as okay and the S&P 1500 version as weak. With small and mid-cap stocks consolidating for the better part of 5-months, the weak rankings in the S&P 1500 composite shouldn't be a surprise as breadth typically deteriorates in that environment.
Suppose we zoom in on the 10/28/21 ranking. In that case, we see a notable decline from the most recent levels and a historically low ranking for both indexes. When I looked at the components within the composite, I noticed a sharp drop in one of the short-duration indicators ending on 10/27/21. For example, the percentage of members above their respective 10-day average for the S&P 500 fell from 97.73% to 45.45 in five days. And, the decline unfolded as the index increased by 34 bps over that period. If you look at the performance of the S&P 500 equal-weighted index, it shows a loss of 90 bps over that same time frame.
The internal rotation between a handful of mega-cap stocks, mainly in the technology sector, and the average index constituent continues to impact the breadth composite rankings in a slightly negative way. However, short-term weak breadth conditions due to rotation are not outright negative for cap-weighted indexes.
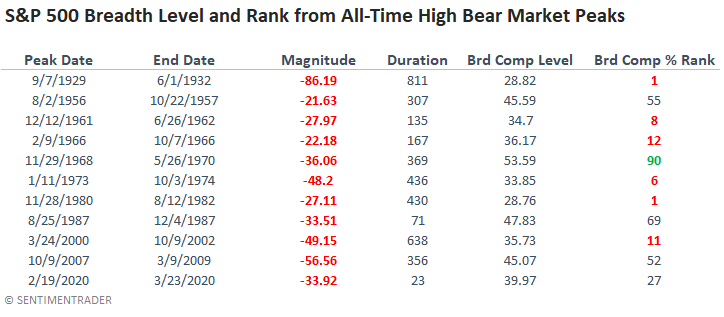
HISTORICAL PERSPECTIVE
The following table provides a snapshot of the breadth composite level and ranking for significant market peaks throughout history. Typically, bear market peaks are associated with weak breadth conditions.
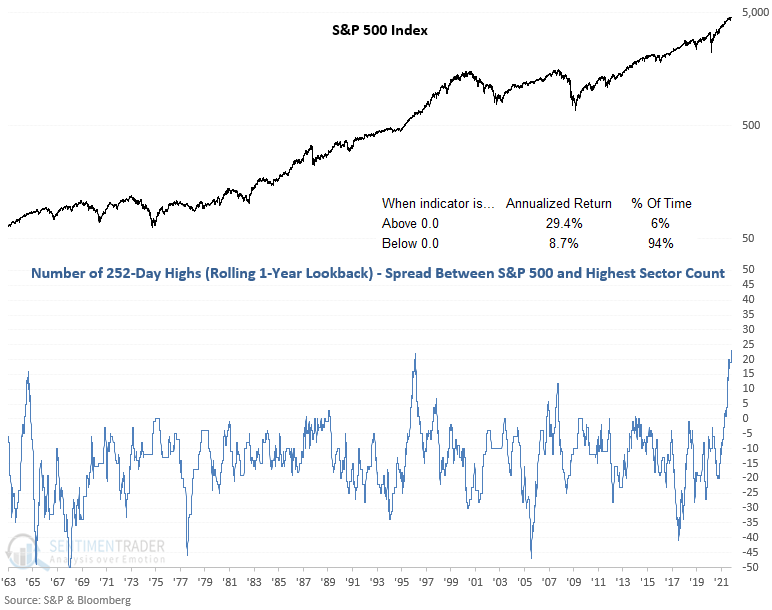
ROLLING HIGH COUNT SPREAD CHART
The following chart contains the 252-day rolling high count spread between the S&P 500 and the sector with the highest count. The indicator surpassed the highest level in history on 10/28/21. I think this chart provides a good perspective on why internal rotation is not a negative. While it's rare, the market performs better when the S&P 500 rolling count spread is above zero. i.e., the S&P 500 is registering more new highs than the sectors within the index.