
Margin Debt as a Trend-Following Indicator

Investors who hold margin accounts can borrow money to increase the leverage of their stock holdings. As a result, NYSE Margin Debt provides a useful measure of the amount of speculative fervor among investors at any given point in time.
In general:
- When margin debt is rising, it suggests investors are bullish and willing to push their bets using leverage
- When margin debt is falling, it suggests investors are bearish and are actively reducing their exposure to risk
Margin debt can reach extreme levels and serve as a warning sign of potential intermediate-term trouble (as Jason has written about here and here). We will focus solely on using the NYSE Margin Debt indicator as a trend-following tool for this article.
NYSE MARGIN DEBT VERSUS ITS 12-MONTH MOVING AVERAGE
We use the latest data available for NYSE margin debt at the end of each month for testing. We then calculate a 12-month moving average and take the difference between the two:
A = Latest NYSE Margin Debt (as of the end of each month)
B = 12-month moving average of A
C = (A-B)
The chart below displays the value for Variable C at the end of each month since December 1945.
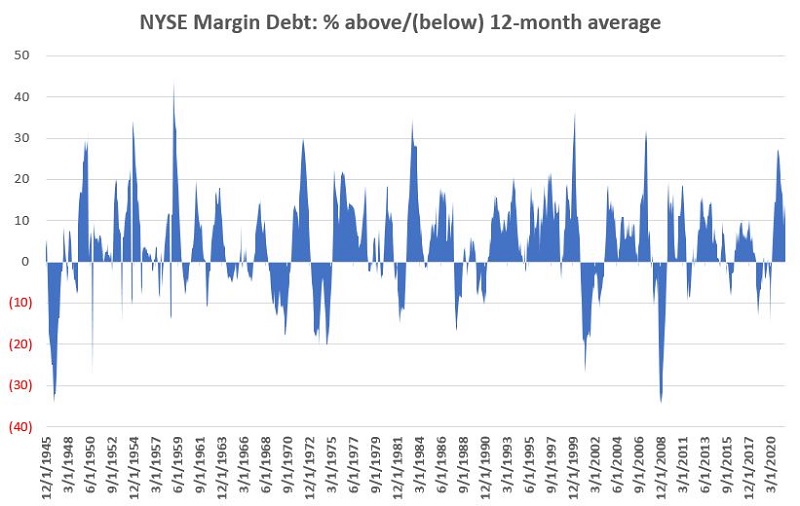 Interpretation is pretty rudimentary:
- C > 0 = Favorable for stocks (bull market probability is high)
- C < 0 = "Unfavorable" (or more accurate, less favorable) for stocks (bear market is possible)
THE RESULTS
The chart below displays the growth of $1 invested in the S&P 500 Index (SPX) ONLY when NYSE Margin Debt is ABOVE its 12-month moving average.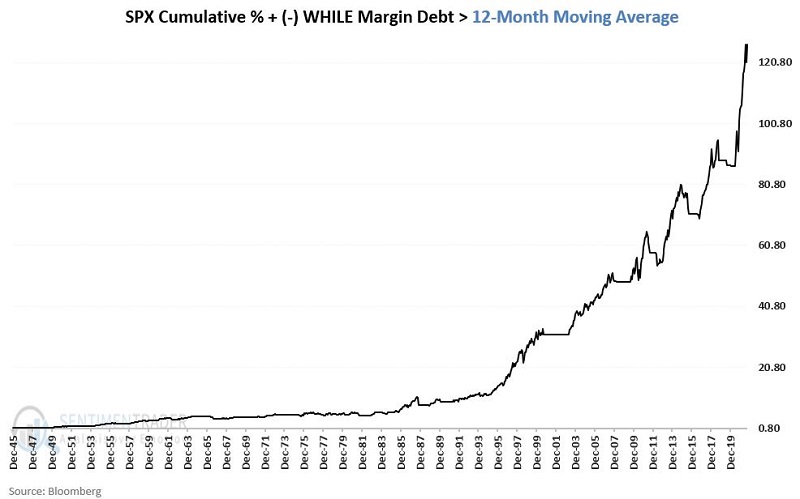
To better highlight the consistency, the chart below shows the same data as the chart above on a logarithmic scale (i.e., the distance between 0.80 and 8.00 is the same as the space between 8.00 and 80.00).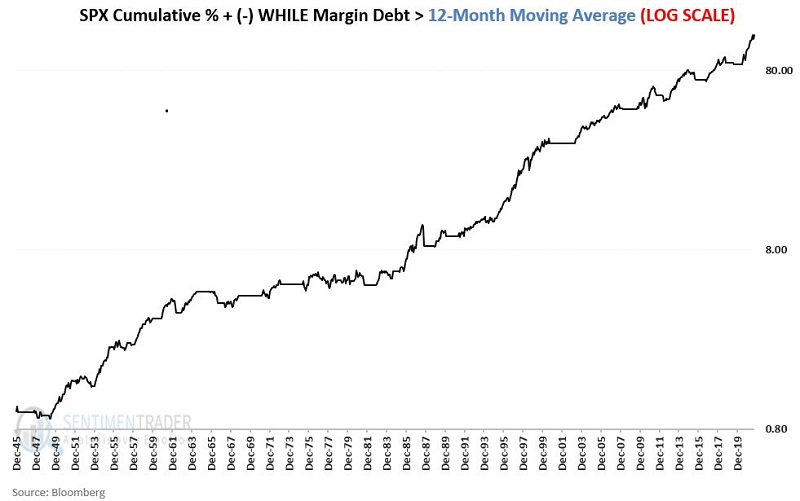 The chart below displays the growth of $1 invested in the S&P 500 Index (SPX) ONLY when NYSE Margin Debt is BELOW its 12-month moving average.
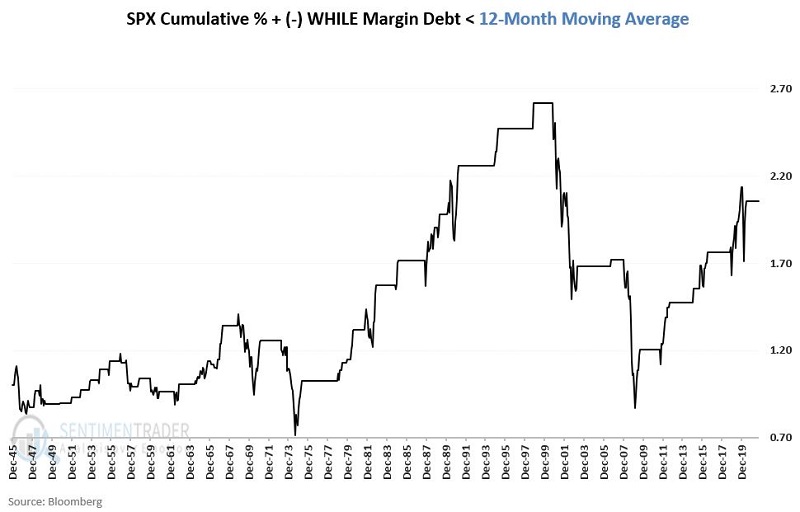 Note that the S&P 500 Index did gain ground overall during "Unfavorable" periods (i.e., when margin debt was below 12-month MA). However, in the chart above, we can note two important things:
- The inconsistent nature of the returns during these periods
- The bulk of all bear market declines occurred while this measure was "Unfavorable"
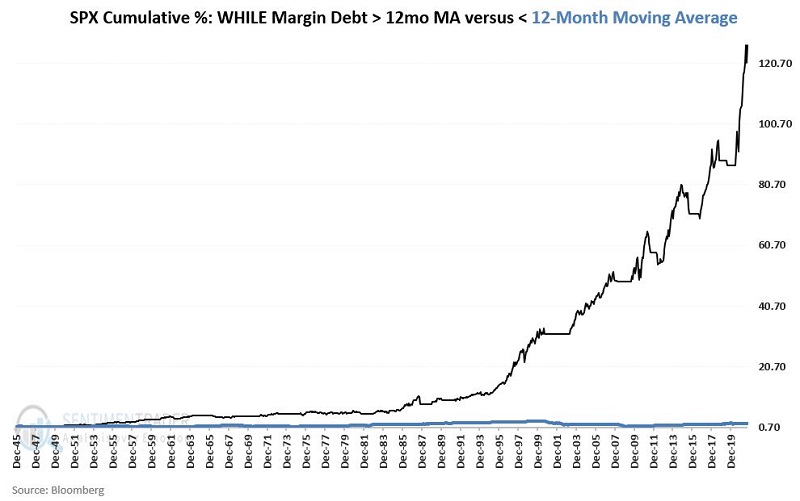
Finally, to highlight the magnitude of the difference in returns over time, the chart below displays the cumulative growth of $1 during all "Favorable" (black line) and "Unfavorable" (blue line) periods.
 BY THE NUMBERS
The table below summarizes the results.
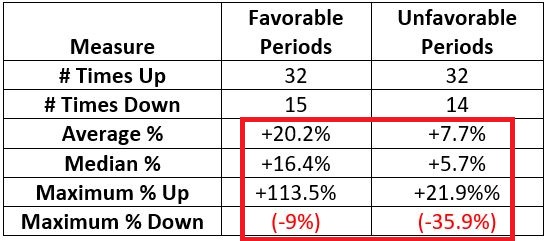
Interestingly, the percentage of winning trades is almost exactly equal during both favorable and unfavorable periods. However:
- "Favorable" periods have much higher Average %, Median %, and Maximum % returns
- The worst return for a "Favorable" period has been -9%
- On the other hand, "Unfavorable" periods have seen declines over -9% on seven separate occasions
The #1 Takeaway from this study:
When NYSE Margin Debt is ABOVE its 12-month moving average:
- The odds of a bull market are extremely high
- The odds of a bear market are extremely low
- Investors should give the bullish case the benefit of the doubt