Products
SentimenTrader Trading Tools
‍
Backtest Engine
My Trading Toolkit
Correlation Analysis
Seasonality
Market Prediction
Indicators & Data API
‍
Proprietary Indicators & Charts
Market Data API
Strategies & Scanner
‍
50+ Trading Strategies
Smart Stock Scanner
Smart Option Scanner
Research Reports
‍
Research Solutions
Reports Library
Free Resources
Simple Backtest Calculator
Simple Seasonality Calculator
The Kelly Criterion Calculator
Sentiment Geo Map
Public Research Reports
Education
Sentiment Indicators
Technical Indicators
Pricing
Company
About
In the News
Testimonials
Client Success Stories
Contact
Log inLoginSign up
< BACK TO ALL REPORTS

Major Reversal; Jump In New Lows; Dumb Money Purge

Jason Goepfert
2018-10-24
null

After the big reversal on Tuesday, futures were indicated to gap lower again on Wednesday. In the history of the S&P 500 futures, that had led to rebounds over the next several sessions every time.

As it stands now, futures have recovered, which dampens the short-term outlook quite a bit. Regardless of what the futures are doing this morning, yesterday's rebound from the large negative open stands as one of the largest during an uptrend, at least when defining "uptrend" as a rising 200-day average, which it still is.

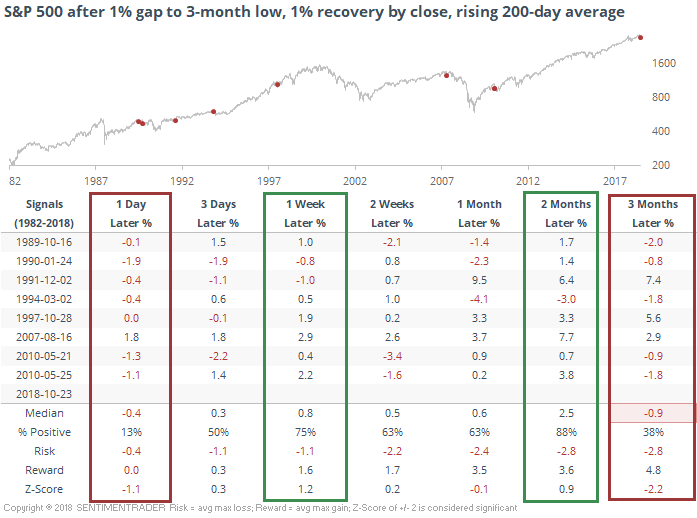
There wasn't usually a lot of very short-term follow-through, but there was from 1-8 weeks later. After two months, there was only a single loss. But high volatility like this during an uptrending market hasn't always been a good longer-term sign, and by three months later we can see that there were quite a few losses.

There was also a jump in new 52-week lows on Tuesday, especially focused among a few sectors.

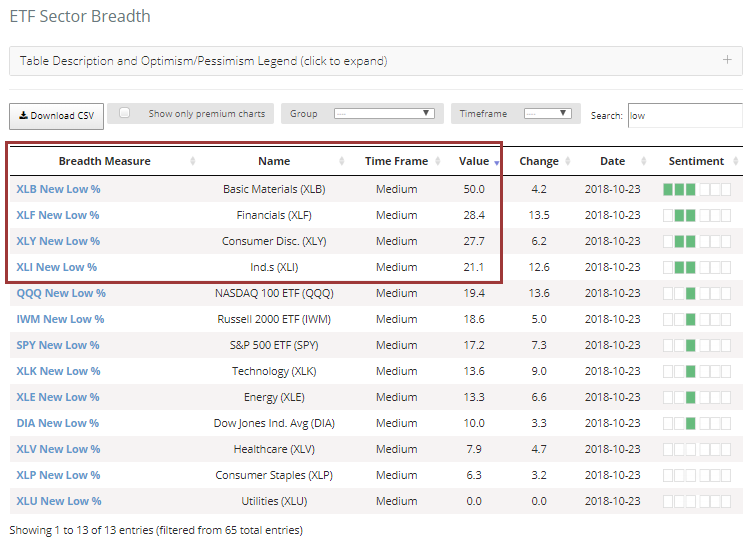
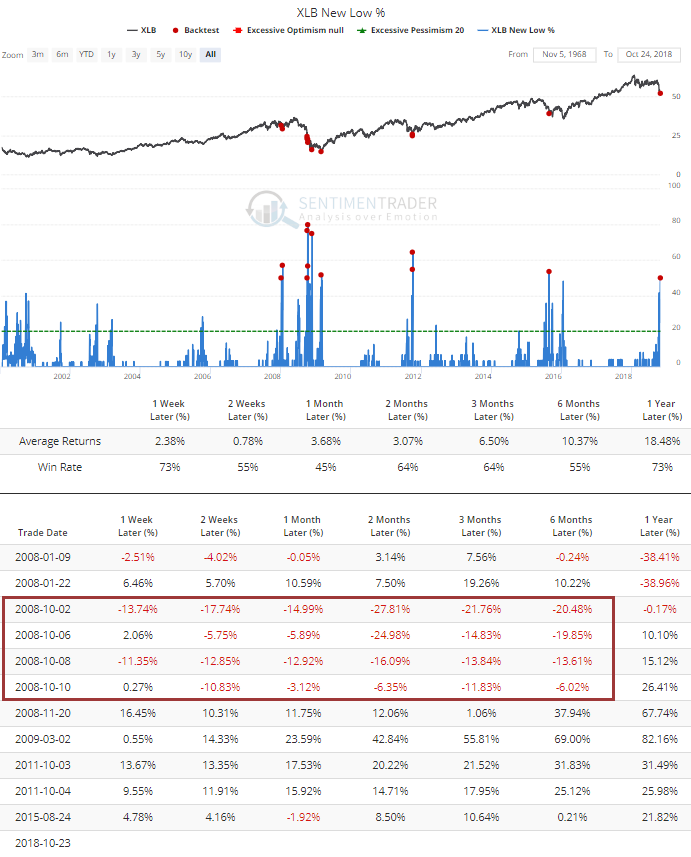
For Basic Materials, it was a really bad day, with half the components in the sector sinking to a new low. Going back to 2000, it has been rare to see this kind of purge. It led to rebounds over the next 2-3 months, except for during the worst of the financial meltdown.

The general malaise led to a jump in our indicators hitting excessive pessimism levels. By the close on Tuesday, more than a third of our core indicators were showing pessimism. Since the 2009 bottom, a reading this high has led to limited downside.

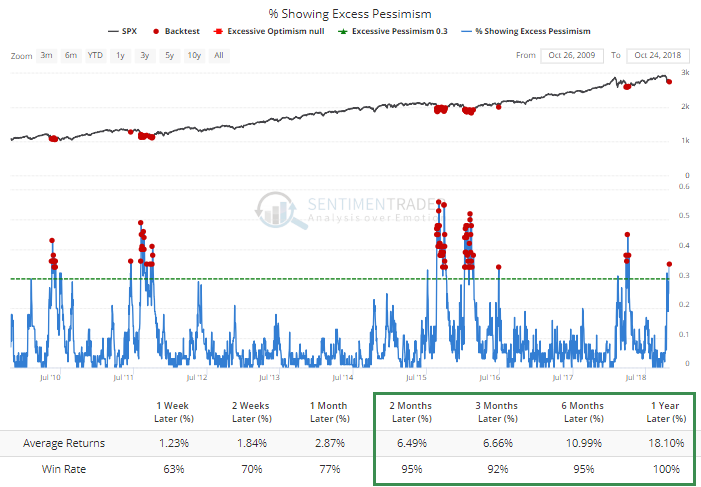
The biggest caveat there is "since the 2009 bottom" - during a bear market, this figure will get much, much higher (like above 50%) before we could conclude there is an overall level of excess pessimism.

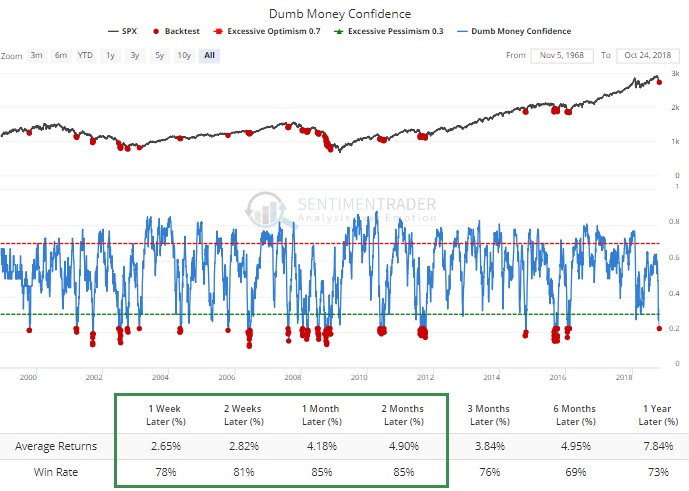
A good sign is that a lot of those indicators reaching extreme pessimism are of the "dumb money" variety, so Dumb Money Confidence has dropped below 23%. We don't often see this during a bull market. Even when we include the bear markets, future returns over the next 1-8 weeks have been very good, and consistently positive.

Tuesday's test of the mini-panic low from earlier this month, and the subsequent reversal, is classic bottoming behavior. In years past, that was a fantastic signal to go long and hold for weeks, at least. I'm less convinced of the merits of classical technical patterns nowadays, though, due to the proliferation of automated trading strategies and the influence of late-day ETF buy/sell pressure. Even so, the setup looks good from the long side in terms of risk/reward over the short- to medium-term, even if we're in the final stages of ultimately rolling over into a bear market.

PRODUCTS
SentimenTrader
Trading Tools
Indicators & Data API
‍
Strategies & Scanner
‍
Research Reports
FREE
RESOUrCES
Simple Backtest
Calculator
Simple Seasonality
Calculator
The Kelly Criterion
Calculator
Sentiment Geo Map
‍
Public Research Reports
‍
Education
Sentiment Indicators
‍
Technical Indicators
‍
Pricing
Bundle pricing
‍
FAQ
‍
Announcements
‍
COMPANY
‍
About
‍
In the News
‍
Testimonials
‍
Client Success Stories
CONTACT
‍
General Inquiries
‍
Media Inquiries
‍
Financial Professionals Inquiries
‍
© 2026 Sundial Capital Research Inc. All rights reserved.
Setsail Marketing
TermsPrivacyAffiliate Program
Risk Disclosure: The information and tools provided are for research and analytical purposes only and are not intended as investment advice. Market analysis involves uncertainty, and outcomes may differ from expectations. Users should conduct their own due diligence and consider their individual circumstances before making any financial decisions. Past performance is not necessarily indicative of future results.

Hypothetical Performance Disclosure: Hypothetical performance results have many inherent limitations, some of which are described below. No representation is being made that any account will or is likely to achieve profits or losses similar to those shown; in fact, there are frequently sharp differences between hypothetical performance results and the actual results subsequently achieved by any particular trading program. One of the limitations of hypothetical performance results is that they are generally prepared with the benefit of hindsight. In addition, hypothetical trading does not involve financial risk, and no hypothetical trading record can completely account for the impact of financial risk of actual trading. for example, the ability to withstand losses or to adhere to a particular trading program in spite of trading losses are material points which can also adversely affect actual trading results. There are numerous other factors related to the markets in general or to the implementation of any specific trading program which cannot be fully accounted for in the preparation of hypothetical performance results and all which can adversely affect trading results.

Testimonial Disclosure: Testimonials appearing on this website may not be representative of other clients or customers and is not a guarantee of future performance or success.