
Macroeconomic data has gone from bad to worse

Key points:
- The Macro Index Model declined to a significantly low level in December
- After similar contractions, annual returns for the S&P 500 look extremely unfavorable
- Other macro-based indicators also paint a negative outlook for stocks
The macroeconomic environment continues to deteriorate
The SentimenTrader Macro Index Model combines 11 diverse economic indicators to determine the state of the U.S. economy. With the most recent update, which captured the final December numbers for several components, the model deteriorated to a level associated with extremely negative annualized returns for the S&P 500.
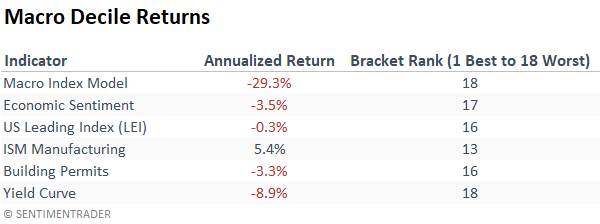
The Macro Index Model is not alone, as several other macroeconomic indicators decreased to historically low levels, which have tended to generate adverse conditions for the stock market.
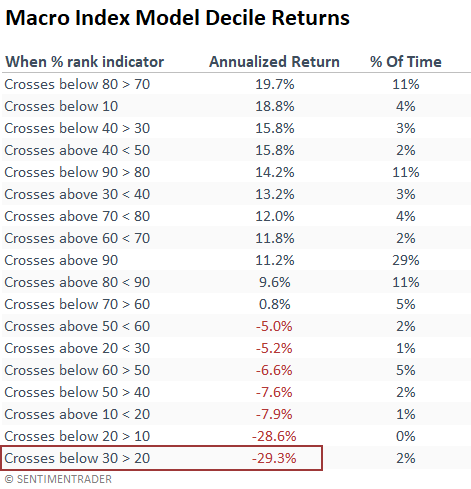
Usually, the team at SentimenTrader utilizes a signal-driven approach to identify a single cross above or below a threshold level to measure forward returns across time. Today's analysis will use a bracket methodology to capture annualized returns based on a cross above or below a decile ranking. The decile ranking methodology creates 18 conditions from which to measure returns.
Macro Index Model
The Macro Index Model declined to the lowest level in more than a decade. Prior readings of less than 30% have foreshadowed a recession in 7 out of 7 instances.
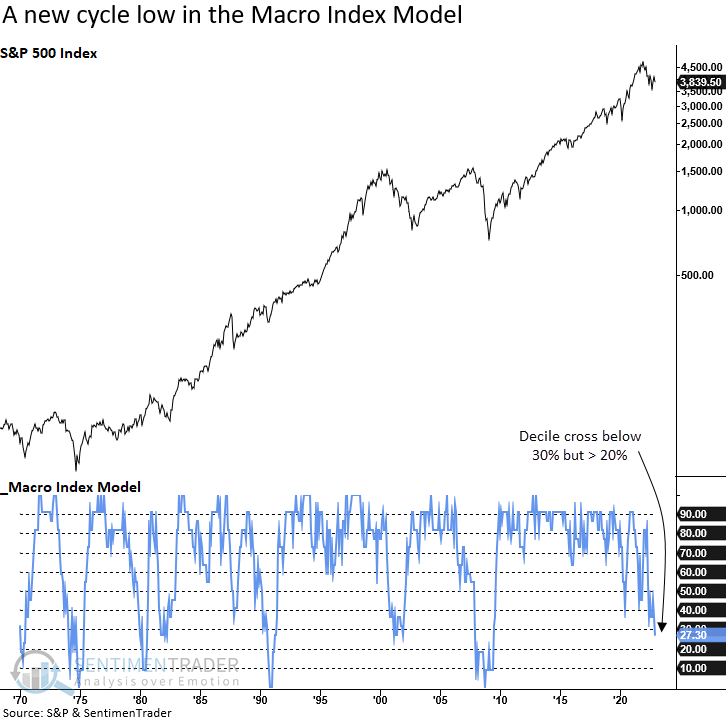
When the Macro Index Model crosses below 30% but remains above 20%, annualized returns for the S&P 500 look abysmal. And if the ranking falls below 20%, it's not much better. However, a cross below 10% suggests good things could happen. i.e., it's so bad, it's good.
Other macroeconomic indicators
My economic and consumer sentiment composite, which measures survey data from small businesses, housing, manufacturing, consumers, and the service sector, crossed below 20% but remains above 10%. Once again, we see another indicator at a decade low.
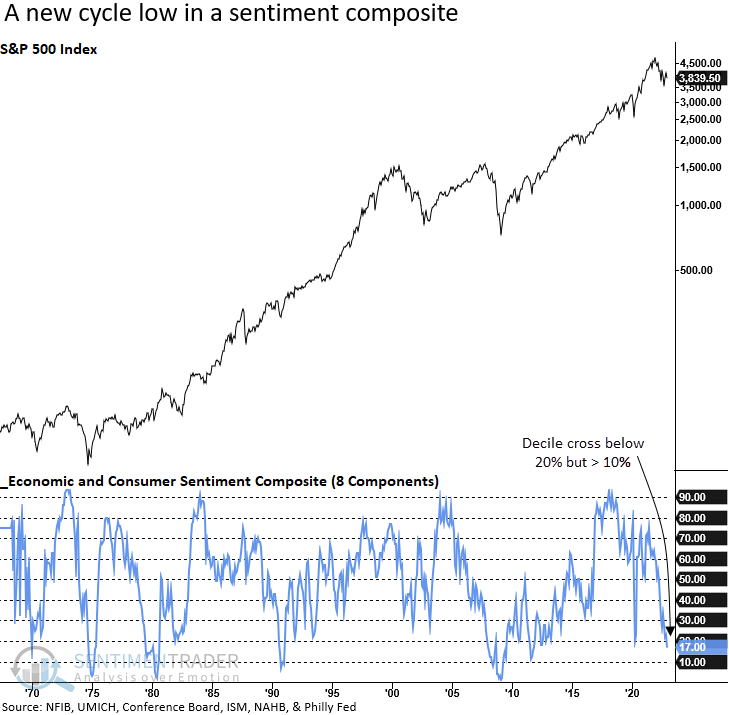
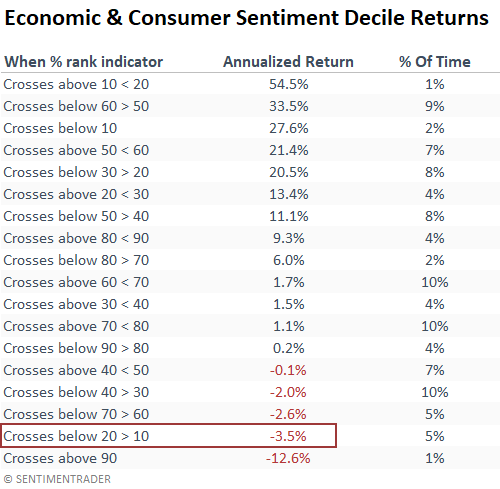
The recent deterioration in the economic and consumer sentiment composite represents the second worst decile bracket, with a -3.5% annualized return. As with the Macro Index Model, the outlook improves significantly should the composite fall further.
The year/year change for the Conference Board's Leading Index (LEI), a composite of ten leading indicators, contracted to the 13th percentile with the November update. December data will be released next week.
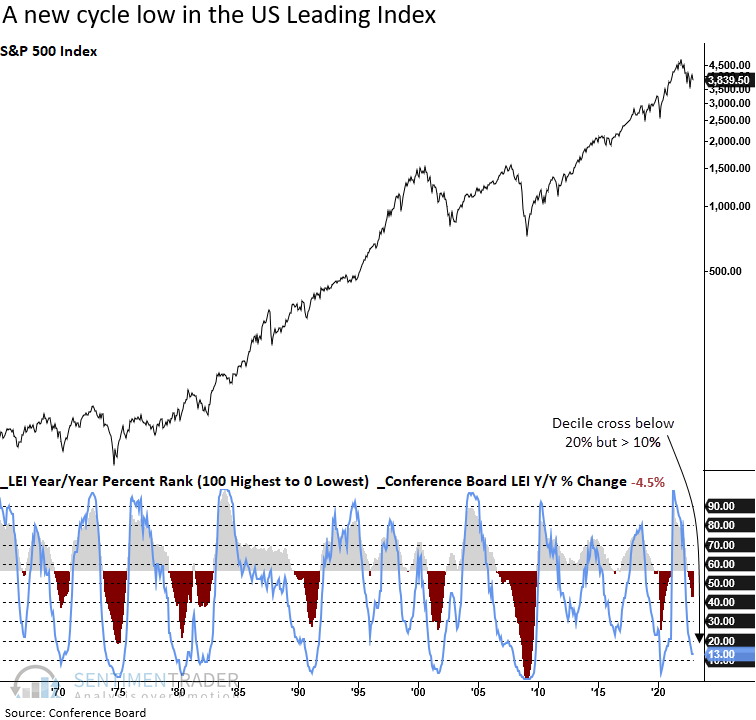
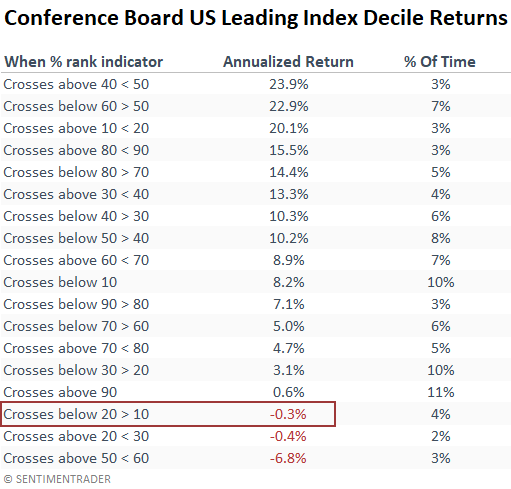
When the percent rank for the LEI falls below 20% but remains above 10%, the annualized returns for the S&P 500 are the third worst of any decile bracket. If we look ahead, the ideal setup occurs when the rank increases above 10%.
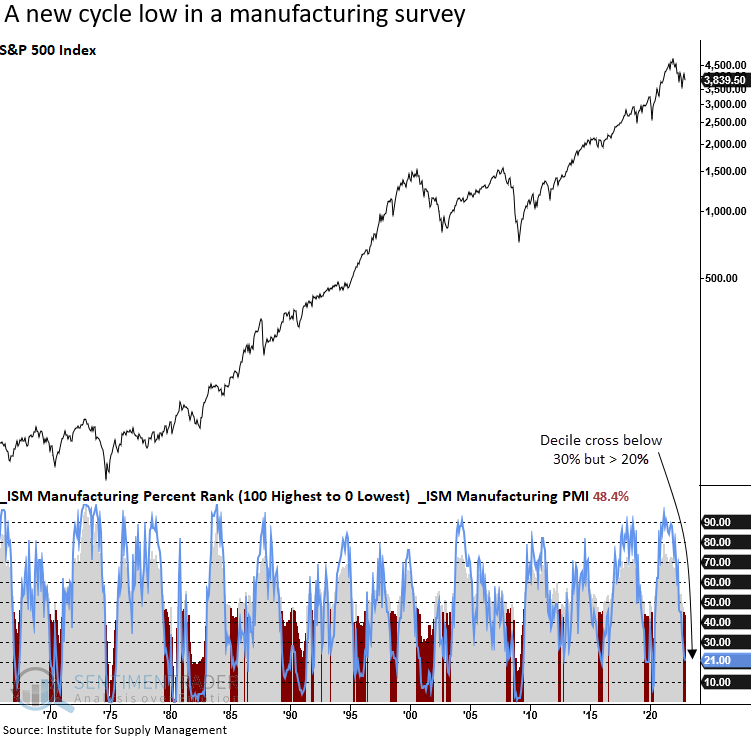
The ISM manufacturing survey continues to deteriorate with a cross below the 30th percentile. The overall level of the PMI now shows two consecutive months below the contraction level of 50.
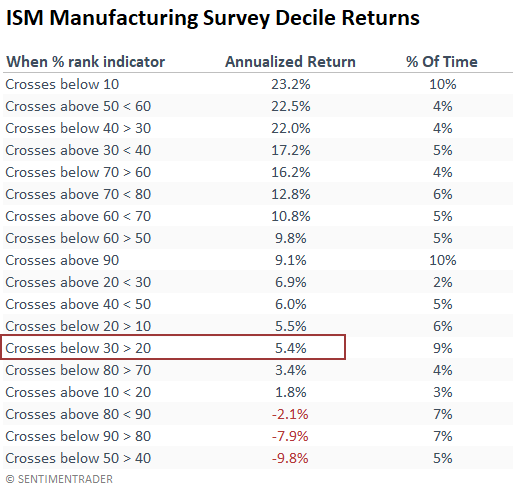
Historical ISM rankings below 30% but above 20% show positive annual returns for the S&P 500. However, the 5.4% return is less favorable than the 7.7% annualized return for the S&P 500 over the study period.
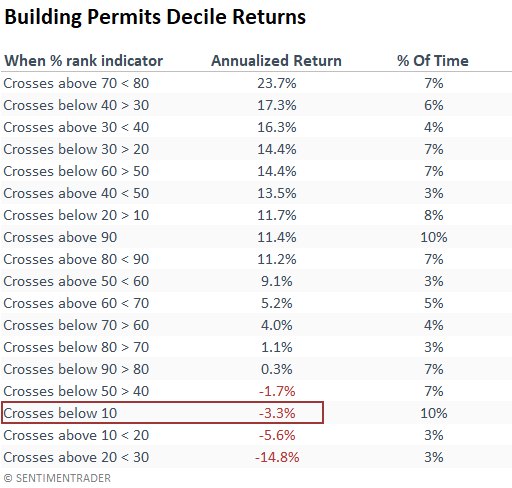
Building permits have fallen to the lowest decile possible, with a year/year decline of almost -30%. History suggests it can remain in this bracket for an extended period.
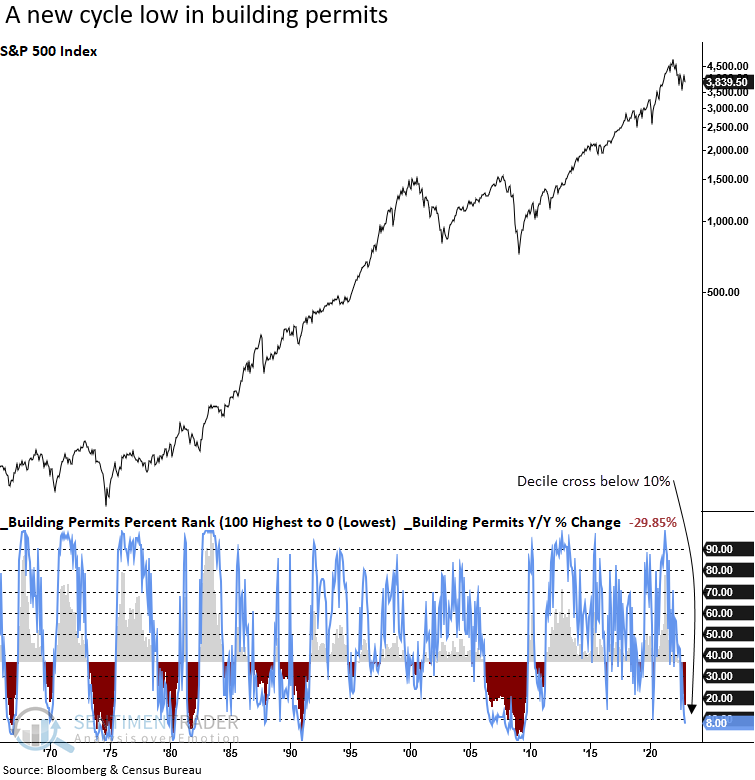
Unlike the other macro indicators, annualized returns are weak when building permits fall into the 10th percentile. The, it's so bad, it's good outlook doesn't apply to this housing data series.
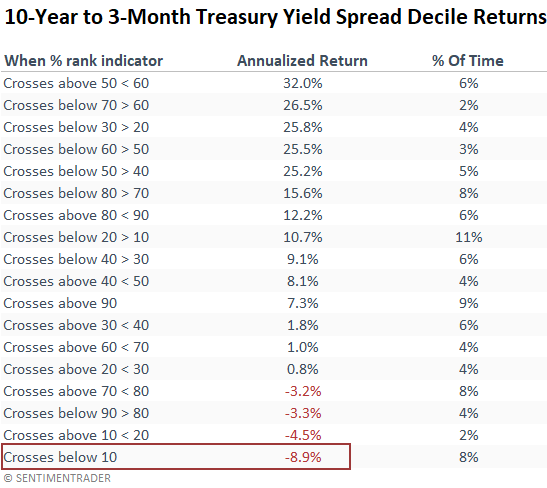
Several months ago, the Treasury yield spread crossed below the 10th percentile and currently ranks in the 1st percentile with the most inverted spread since 1981.
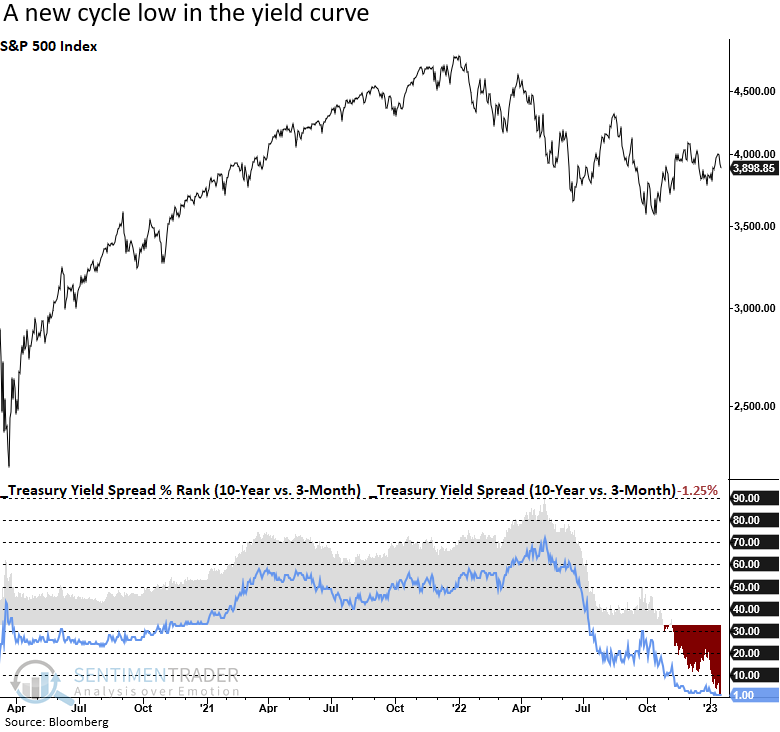
Treasury yield spread rankings below the 10th percentile represent the worst annualized returns for the S&P 500. A cross above the 50th percentile is where it gets interesting.
The weight of the evidence from a macroeconomic perspective suggests caution
With so many macroeconomic indicators in an unfavorable position relative to history, it's hard to get excited about the outlook for stocks, despite some encouraging signs from other market measures like breadth and sentiment.
What the research tells us...
As a market analyst, I've learned over the years that I should never rely upon a single indicator. Nothing is infallible. The same is true for research. One should never depend on a single method for analyzing the market. A weight-of-the-evidence approach that incorporates many disciplines like sentiment, breadth, and macroeconomic indicators gives us a higher probability of success. Over the last year, indicators across multiple research disciplines failed to align. We should get a fat pitch associated with significant market bottoms if and when they do. With macroeconomic data going from bad to worse, we may have to wait a bit longer. Stay alert as several indicators are close to the, it's so bad, it's good, buy zone.