
Macro Index Model plus price action casts a shadow

Key Points
- The Macro Index Model (MIM) offers important clues regarding the current state and future trend of the economy
- MIM just dropped below a significant level on July 1st with the S&P 500 Index already in a downtrend
- 7 of 8 previous such signals since 1969 have seen the S&P decline over the ensuing six months
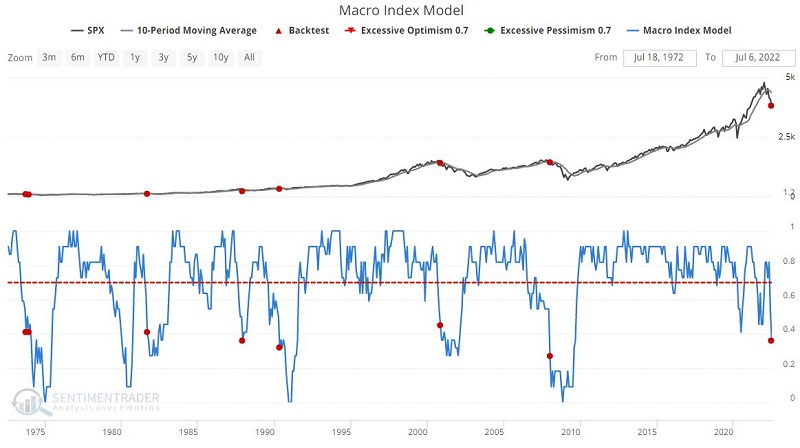
The Macro Index Model
Our Macro Index Model (MIM) combines 11 various economic indicators to determine the state of the U.S. economy right now. Including:
- New Home Sales
- Housing Starts
- Building Permits
- Initial Claims
- Continued Claims
- Heavy Truck Sales
- 10-year - 3-month Treasury yield curve
- S&P 500 vs. its 10-month moving average
- ISM manufacturing PMI
- Margin debt
- Year-over-year headline inflation
This index has plunged in the past several months, suggesting a potentially severe weakening of the economy. This piece looks at stock market index movement based on the combination of MIM signals and price action at the time of the signal.
The chart below displays ALL times when the MIM dropped below 0.46, and the table shows a summary of S&P 500 Index performance following all signals. The most recent signal just occurred on 7/1/2022.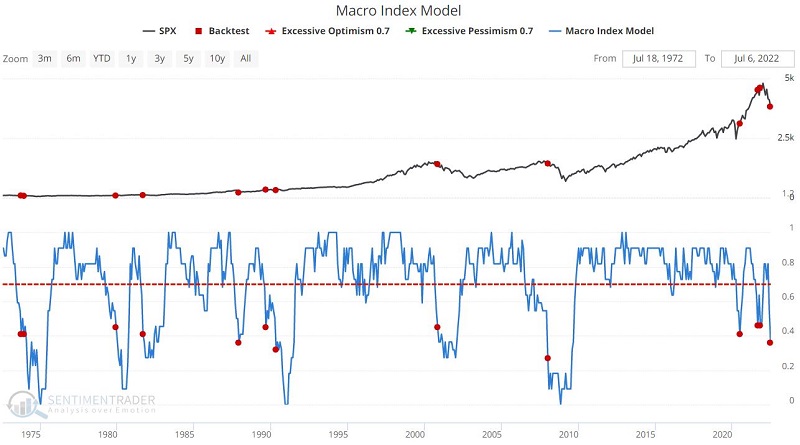
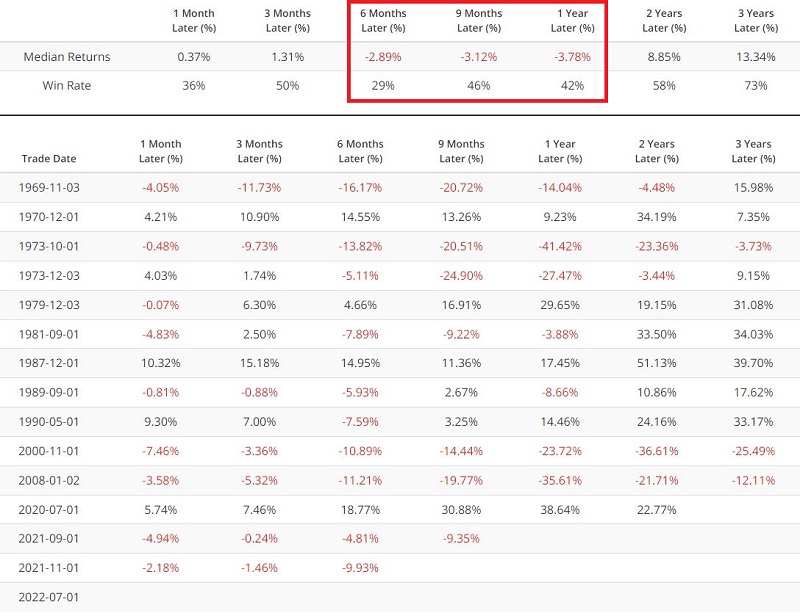
As you can see, the results are very much of a mixed bag. One-year returns showed a gain only 42% of the time. However, on several occasions, some gains were quite significant (1979, 1987, 1990, and 2020). Other times a significant bear market ensued (1969, 1973, 2000, and 2008).
Is there a way to discern which signals might be better or worse than others? (Would I ask the question if the answer was "No"?)
MIM signals when SPX is trending up
The chart below displays those times when:
- MIM dropped below 46
- AND the S&P 500 Index was ABOVE its 10-month moving average
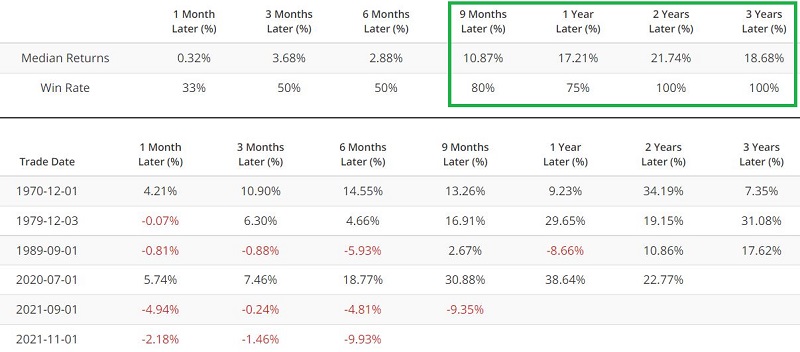 There are two things to note:
- Historically, results have been primarily positive
- The two signals that occurred in 2021 have NOT followed suit with the previous signals (SPX down -15% and -17% since those two signals)
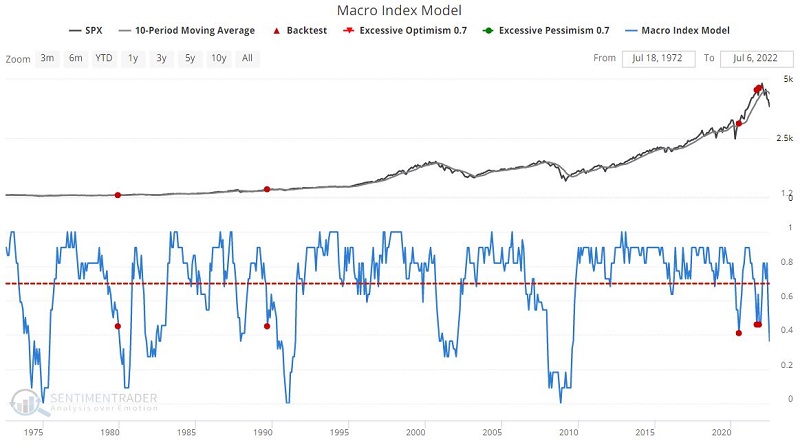
MIM signals when SPX is trending down
The chart below displays those times when:
- MIM dropped below 46
- AND the S&P 500 Index was BELOW its 10-month moving average
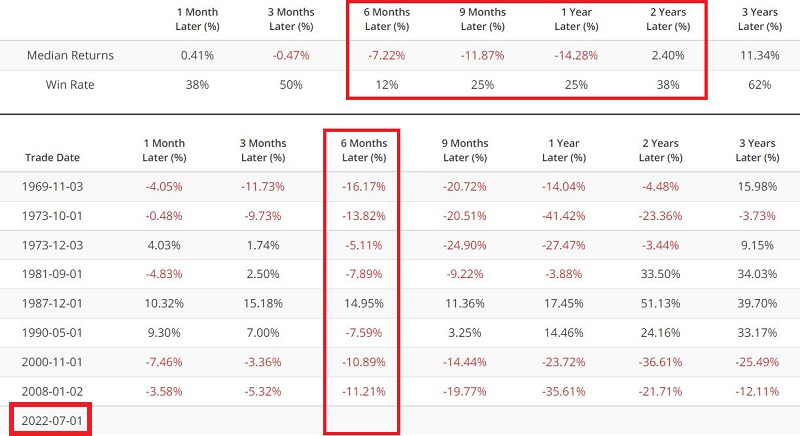
There are several things to note:
- Historically, results have been highly subpar
- All time frames from 6 months to 2 years have a Win Rate of less than 50%
- Both the 1987 and 1990 signals shrugged off this negative MIM/Price combination
- The major bear markets (1969, 1973, 2000, 2008) were all marked by this signal
- The most recent signal occurred on 7/1/2022
The implications
The reality is that an investor can see whatever they "want to see" in these results. An individual with a bullish tilt will focus on the two signals in late 2021 and anticipate a strong rebound. They may also focus on the fact that the supposedly bearish signals in 1987 and 1990 saw the stock market rebound strongly.
An investor with a bearish tilt will focus on the latest signal and the mostly unfavorable results that have followed previous signals, with the S&P 500 Index already below its 10-month moving average.
What the research tells us...
We defined an "uptrend" as SPX above its 10-month moving average and a downtrend as SPX below its 10-month moving average. The historical bias is unmistakable: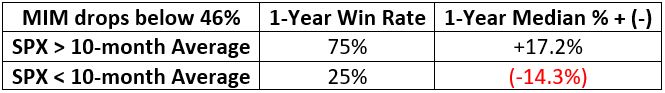
The latest signal does not guarantee a recession or further stock market decline. It does, however, lend significant weight to the bearish case for both the economy and the stock market.