
Macro Good, Macro Bad

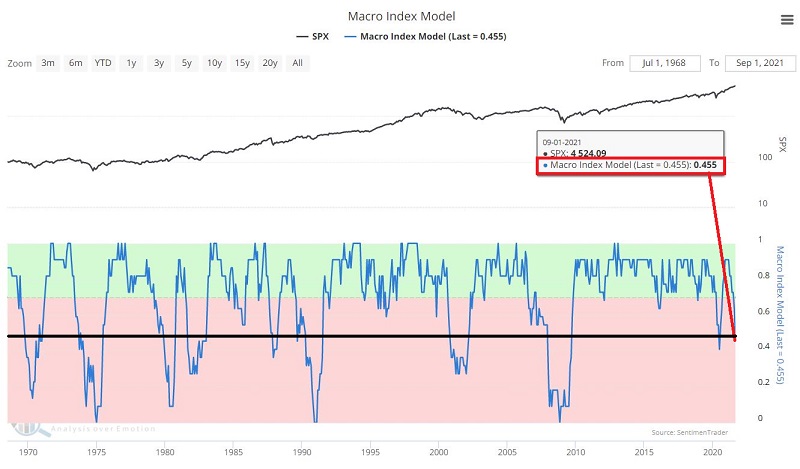
The Sentimentrader Macro Index Model is designed to track the ebb and flow of an economic expansion. To differentiate "temporary slowdowns" from real problems, we look for SIGNIFICANT macro deterioration. Our Macro Index combines 11 diverse economic indicators to determine the state of the U.S. economy right now.
- New Home Sales
- Housing Starts
- Building Permits
- Initial Claims
- Continued Claims
- Heavy Truck Sales
- 10 year - 3-month Treasury yield curve
- S&P 500 vs. its 10-month moving average
- ISM manufacturing PMI
- Margin debt
- Year-over-year headline inflation
At the end of August, the Macro Index Model dropped from .636 to 0.455.
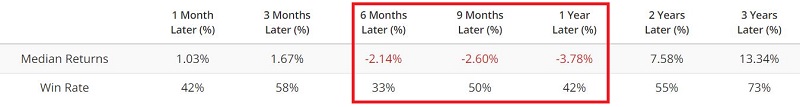
Historically, S&P 500 Index returns in the year ahead following a drop below 0.46 have been lukewarm at best and certainly well below average.
If we consider the price trend for the S&P 500 Index when the Macro Index Model drops below 0.46, a different pattern emerges.
WHEN PRICE IS STRONG
For the first test, we will look at those times when:
- Macro Index Model crossed below 0.46
- S&P 500 Index is currently ABOVE its 10-month moving average
The signal dates are highlighted in the chart below, and the performance numbers appear in the table below that.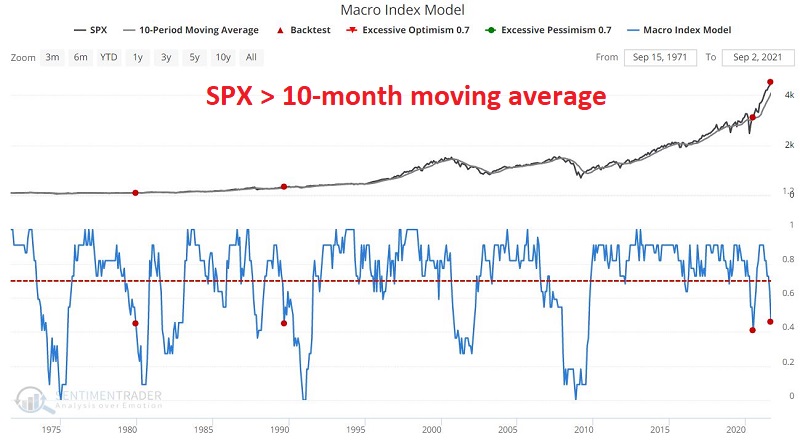
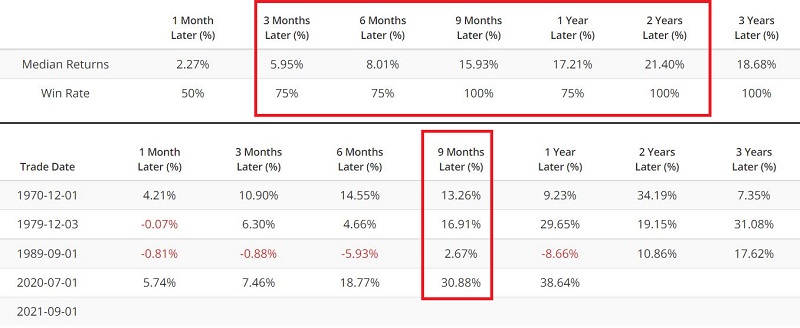
Previously, when the Macro Index Model has broken down while accompanied by price strength, stock market performance going forward has been fairly robust.
- Median Returns for 3-months to 2-year have been quite positive and progressively higher at each time frame
- Win Rates after 1-month have been 75% to 100%
It should be noted that these results are based on a very small sample size.
WHEN PRICE IS WEAK
For the second test, we will look at those times when:
- Macro Index Model crossed below 0.46
- S&P 500 Index is currently BELOW its 10-month moving average
The signal dates are highlighted in the chart below, and the performance numbers appear in the table below that.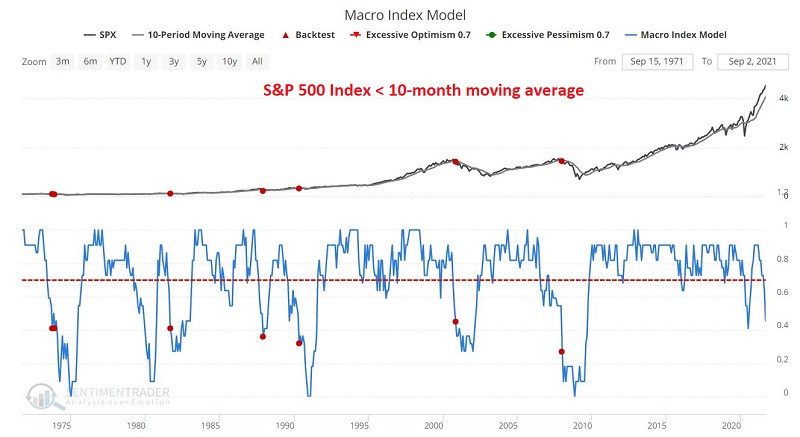
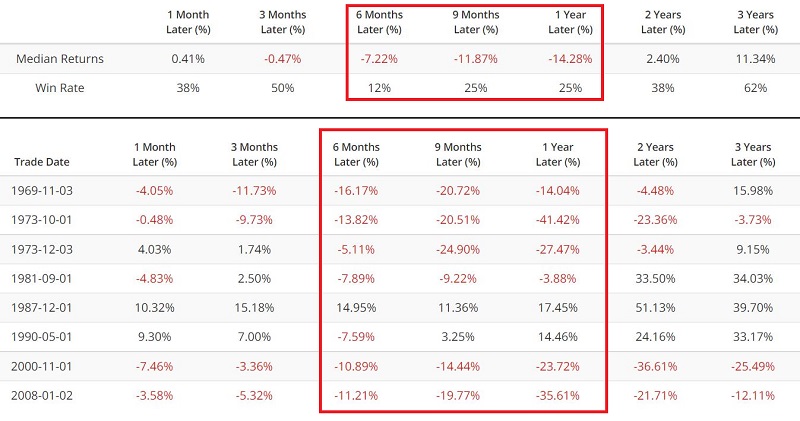
When Macro breaks down accompanied by price weakness, the damage tends to be severe:
- Median Returns for 3-months to 1-year have been negative
- Win Rates from 6-month to 2-years have been below 50%
These results are also based on a relatively small sample size.
SUMMARY
The Macro Index Model signal on 7/1/2020 with the price of the S&P 500 Index above its 10-month moving average was followed by the powerful rally we have seen in the last year.
On 9/1/2021, a new Macro Index Model signal - again with the S&P 500 Index above its 10-month moving average - occurred. Does this mean we can ignore the near-term deterioration in the economy and wait for stock prices to power higher?
Not necessarily. But for now, this particular combination of technical and fundamentals suggests continuing to give the bullish case the benefit of the doubt.