Data &
Technology
Research
Reports
Report Solutions
Reports Library
Actionable
Strategies
Free
Resources
Simple Backtest Calculator
Simple Seasonality Calculator
The Kelly Criterion Calculator
Sentiment Geo Map
Public Research Reports
Free Webinar
Pricing
Company
About
Meet Our Team
In the News
Testimonials
Client Success Stories
Contact
Log inLoginSign up
< BACK TO ALL REPORTS

Macro Conditions Are Plunging

Jason Goepfert
2021-09-07
Our Macro Index Model is declining and is now almost to the level from the pandemic.

The fundamental outlook is deteriorating. We've seen that in a drumbeat of reports that have disappointed economists in recent weeks.

The SentimenTrader Macro Index Model is designed to track the ebb and flow of an economic expansion. To differentiate "temporary slowdowns" from real problems, we look for SIGNIFICANT macro deterioration. Our Macro Index combines 11 diverse economic indicators to determine the state of the U.S. economy right now.

  • New Home Sales
  • Housing Starts
  • Building Permits
  • Initial Claims
  • Continued Claims
  • Heavy Truck Sales
  • 10 year - 3-month Treasury yield curve
  • S&P 500 vs. its 10-month moving average
  • ISM manufacturing PMI
  • Margin debt
  • Year-over-year headline inflation

At the end of August, Jay notes that the Macro Index Model dropped from .64 to 0.46. 
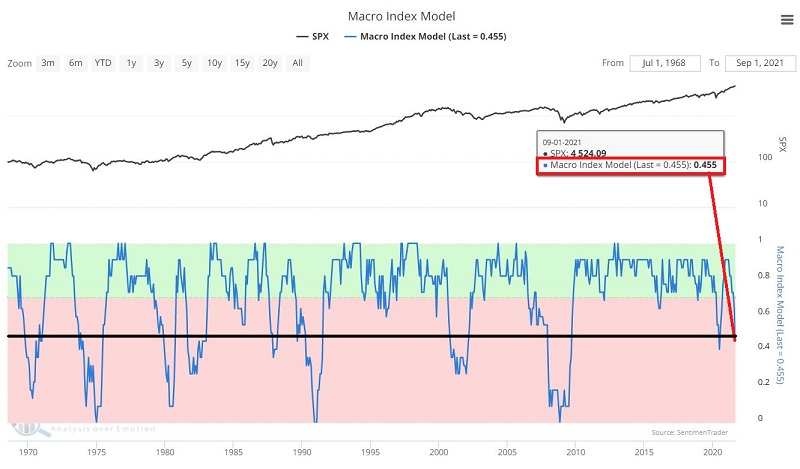
Historically, S&P 500 Index returns in the year ahead following a drop below 0.46 have been lukewarm at best and certainly well below average.

If we consider the price trend for the S&P 500 Index when the Macro Index Model drops below 0.46, a different pattern emerges. Previously, when the Macro Index Model has broken down while accompanied by price strength, stock market performance going forward has been fairly robust, like what happened last year.

It should be noted that these results are based on a tiny sample size, so while we can discount the drop in fundamental inputs, we shouldn't be too confident that it's a non-event entirely.


What else we're looking at

  • Returns following a drop in the Macro Index Model depending on the trend in the S&P 500
  • A reversal signal triggered in the Nasdaq McClellan Oscillator
Stat box

The McClellan Oscillator for the Nikkei 225 has risen above +100 for only the 2nd time in a year. The other was in early November 2020.

Etcetera

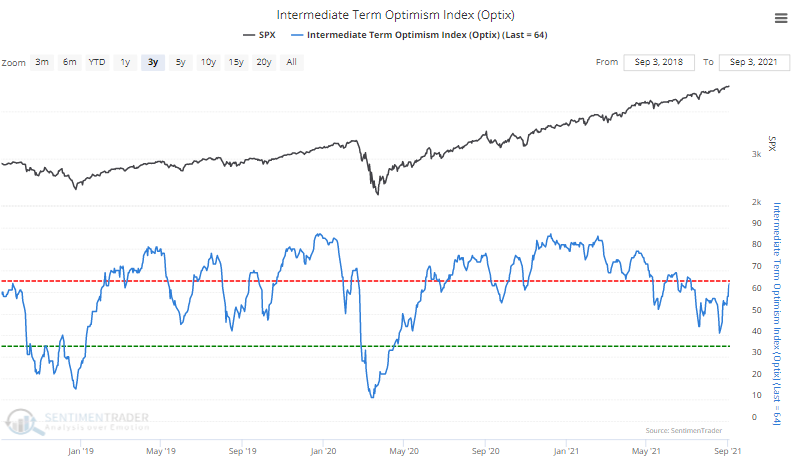
Confidence is coming back. After curiously declining for months, our multi-month Optimism Index is rising back toward "excessive optimism" territory...not that extremes have meant anything in a record-setting year.
optimism index

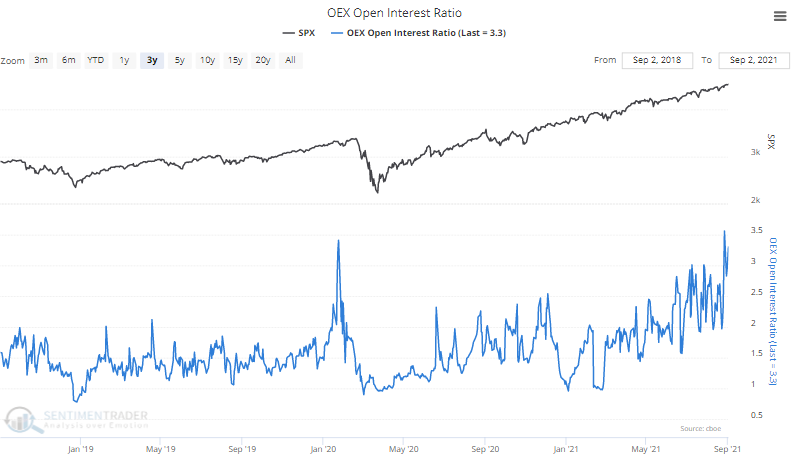
Pockets of pessimism. Not every indicator is showing optimism. There are currently more than 3 put options outstanding for every 1 call option in the OEX, an index of the largest 100 companies in the S&P 500.
oex open interest ratio

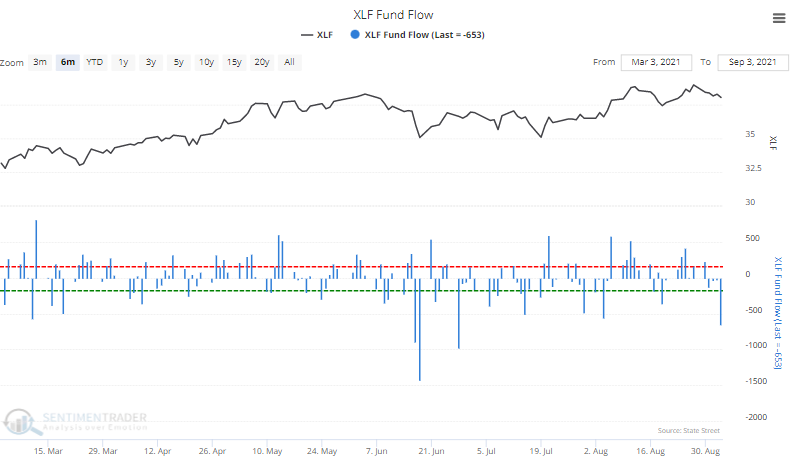
Fleeing Financials. The dip in Financial stocks last week triggered a more than $600 million outflow from the XLF fund, the 4th-largest exodus of the past 6 months.
xlf fund flow

DATA &
TECHnologies
IndicatorEdge
‍
BackTestEdge
‍
Other Tools
‍
DataEdge API
RESEARCH
reports
Research Solution
‍
Reports Library
‍
actionable
Strategies
Trading Strategies
‍
Smart Stock Scanner
‍
FREE
RESOUrCES
Simple Backtest
Calculator
Simple Seasonality
Calculator
The Kelly Criterion
Calculator
Sentiment Geo Map
‍
Public Research Reports
‍
Free Webinar
COMPANY
‍
About
‍
Meet our Team
‍
In the News
‍
Testimonials
‍
Client Success Stories
Pricing
Bundle pricing
‍
Announcements
‍
FAQ
© 2024 Sundial Capital Research Inc. All rights reserved.
Setsail Marketing
TermsPrivacyAffiliate Program
Risk Disclosure: Futures and forex trading contains substantial risk and is not for every investor. An investor could potentially lose all or more than the initial investment. Risk capital is money that can be lost without jeopardizing ones’ financial security or life style. Only risk capital should be used for trading and only those with sufficient risk capital should consider trading. Past performance is not necessarily indicative of future results.

Hypothetical Performance Disclosure: Hypothetical performance results have many inherent limitations, some of which are described below. No representation is being made that any account will or is likely to achieve profits or losses similar to those shown; in fact, there are frequently sharp differences between hypothetical performance results and the actual results subsequently achieved by any particular trading program. One of the limitations of hypothetical performance results is that they are generally prepared with the benefit of hindsight. In addition, hypothetical trading does not involve financial risk, and no hypothetical trading record can completely account for the impact of financial risk of actual trading. for example, the ability to withstand losses or to adhere to a particular trading program in spite of trading losses are material points which can also adversely affect actual trading results. There are numerous other factors related to the markets in general or to the implementation of any specific trading program which cannot be fully accounted for in the preparation of hypothetical performance results and all which can adversely affect trading results.

Testimonial Disclosure: Testimonials appearing on this website may not be representative of other clients or customers and is not a guarantee of future performance or success.