
Losses grow among all assets

Nowhere to go
The human toll that the virus has wreaked across the globe is distressing. Even though it’s “only money,” for investors it has been a wicked reckoning, as losses have been large across assets. The drawdown in stocks, bonds, metals, and commodities – weighted to their average allocation – is among the worst in 50 years.
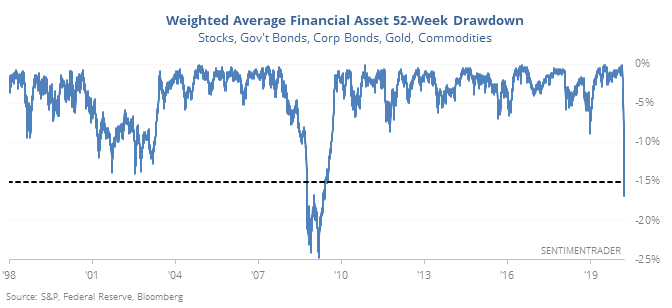
The only date when the average drawdown was at least 15% and even the “best” asset was down at least 5% from its high was the one in March 1980…until yesterday. After that horrid period, stocks shot higher by more than 30% over the next six months.
Not a g'day, mate
Over the past couple of weeks, selling has been severe, persistent, and virtually without anywhere to hide. Outside the U.S., the past few years have been rough for the Australian Dollar, to say the least, and the past few weeks have been brutal.
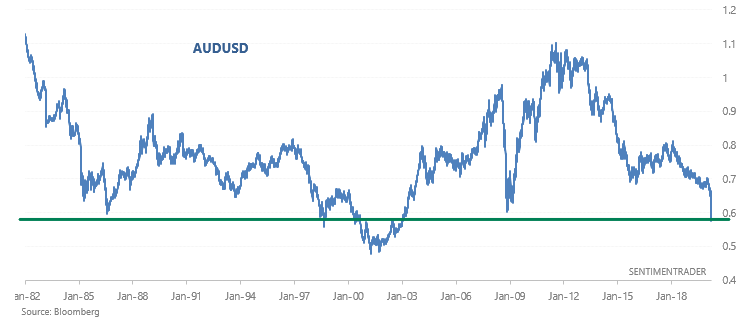
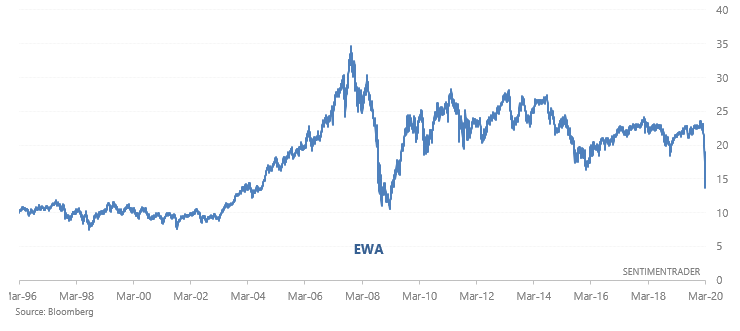
While the S&P/ASX 200 index has dropped -34.1% during this coronavirus-driven crash, the AUDUSD's decline has caused EWA (Australian ETF) to fall -43.2% from top to bottom.
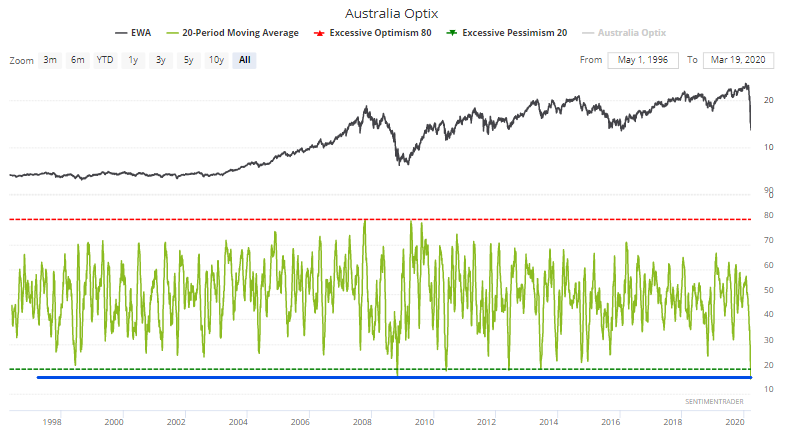
From a trading perspective, Australia Optix's 20 dma is the lowest its ever been - even lower than in 2008. Back then Australian equities chopped a bit lower, but the key point is that the worst of the selling was over.
This is an abridged version of our recent reports and notes. For immediate access with no obligation, sign up for a 30-day free trial now.
We also looked at:
- After 9/11 and in 2008, markets didn't bottom until news flow got more positive
- Government money market funds have seen a record inflow
- The Panic Button keeps setting records
- More in-depth looks at the selling in Australia
- Median % changes across indexes
- The rate of change in bonds