
Looking to financials for a bottoming clue

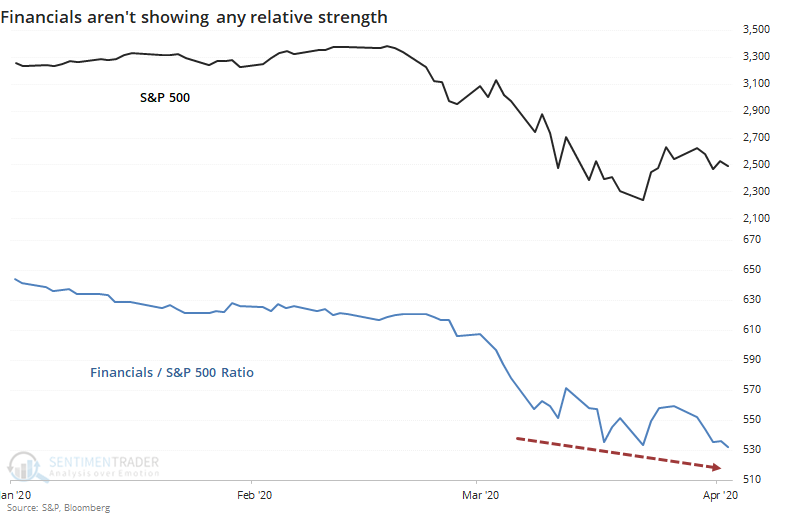
One of the many concerns being bandied about now is the continued relative underperformance of financials. Analysts keep looking for this group to lead, or at least show some signs of relative strength versus the broader market, and they keep disappointing. Even with a big day so far on Monday, the ratio is barely moving.
It raises a good question - at other recent and important low points, did financials turn up relative to the market before stocks bottomed? We'll look at the most recent inflection points, as well as the more important lows since 1928 to see if there's a pattern.
For those who prefer to read the conclusion first, the answer was "no."
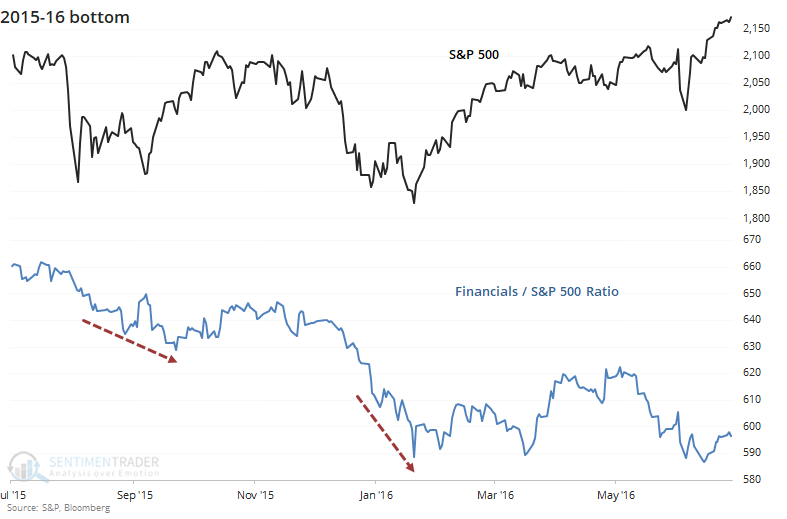
At the bottom(s) in 2015-16, there were negative divergences the whole way. The ratio of the financial sector to the S&P 500 kept hitting lower lows, either along with the S&P or even as the S&P made higher lows. If we were watching the financial sector for clues, we would have dismissed the probability of any kind of a low anywhere around these time frames.
It was no different in 2011. Financials performed horribly around that time, and even as the S&P was stabilizing, financials kept sinking on a relative basis.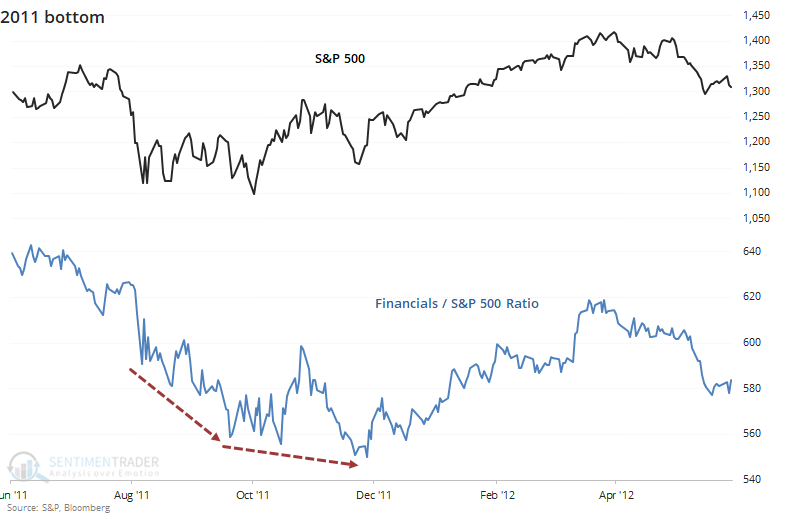
At the major low in 2009, same story. During the depths of the panic in October and November 2008, it's no surprise to see that financials were leading the market lower. That was still the case into the early spring of 2009 as stocks formed a v-shaped bottom and financials were hitting new relative lows that entire time.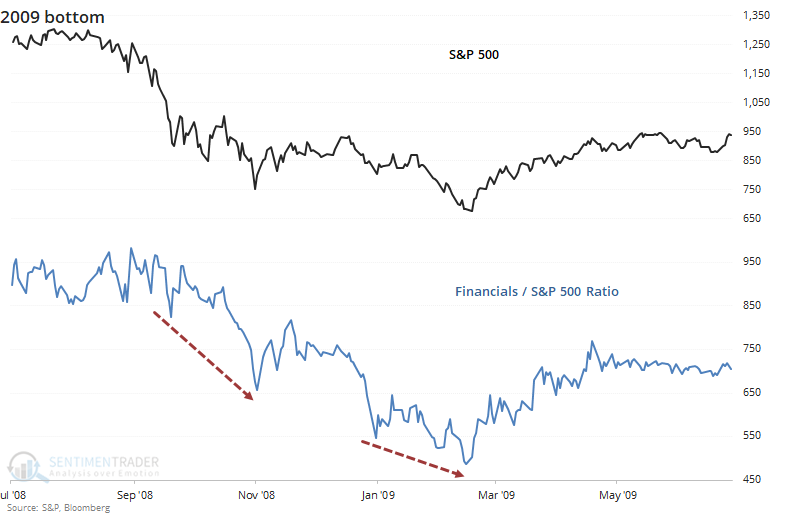
At the other major low that decade, in 2002, it was mostly the same picture but a case could be made there was a larger positive divergence. In October of that year, financials made a clear lower low and would have suggested a failure was imminent. As the S&P rallied then fell again to test the low in early 2003, financials were sinking quickly but at least formed a higher low than the previous October. So that was something of a good sign.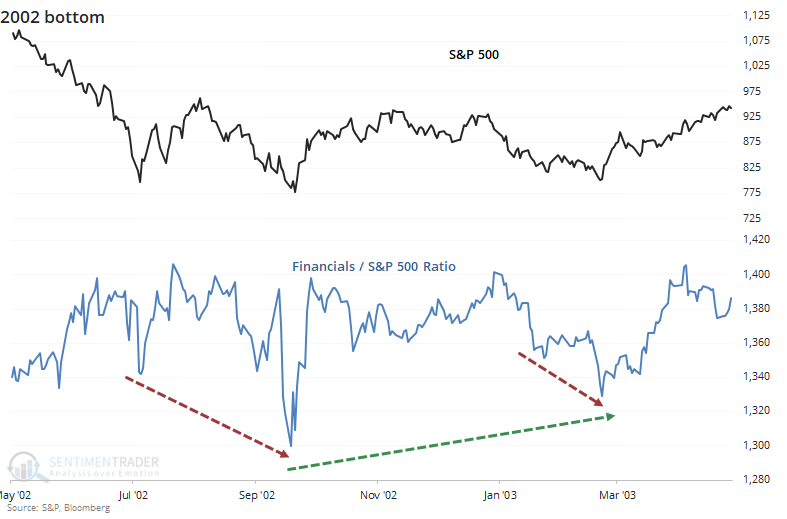
At the medium-term bottoms in 2001, relative strength in financials proved to be a decent sign in March, but didn't provide much of a clue following the tragedy of 9/11. Even as the S&P rebounded strongly, financials kept sinking on a relative basis.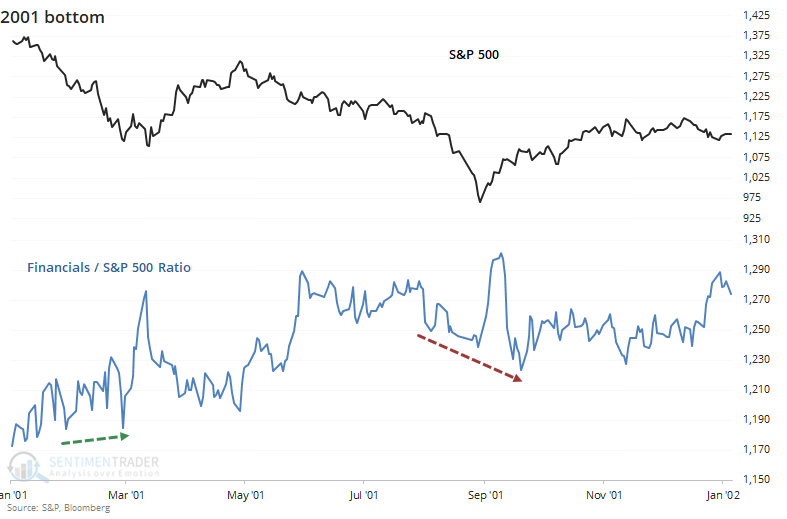
The banking crisis of 1990 saw financial tank drastically even as the broader market held up relatively well. By only following the financials, an investor would have been deeply pessimistic about the probability of a bottom and would have missed out on a massive recovery, or at least would have been negative at the lows.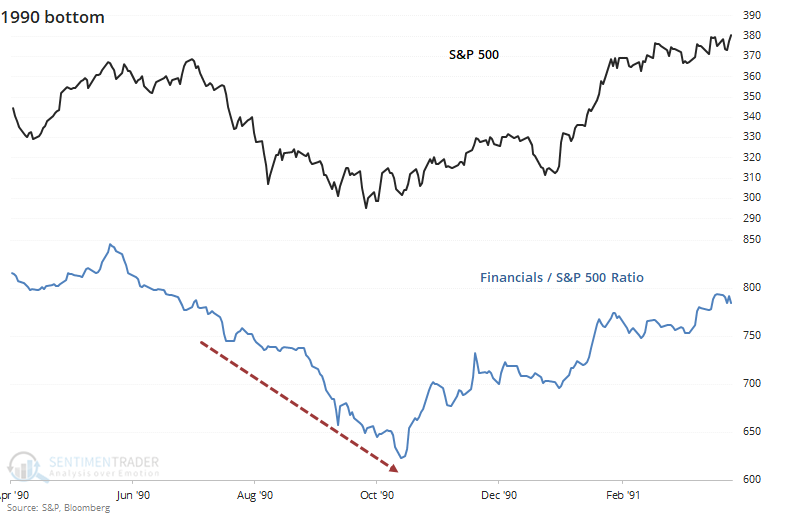
During the crash of 1987, there was a chaotic spike in relative strength that quickly evaporated. By the time stocks bottomed in December, financials were hitting a years-long relative low, and an investor watching this sector for clues would have once again been misguided.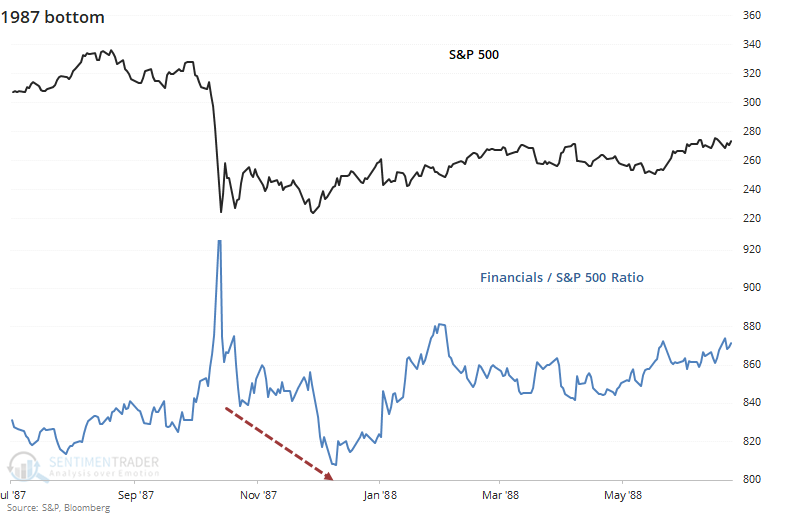
The big bottom in 1974 is the one case where analysts using this method could cherry-pick as a reason to watch for relative strength from this sector. As stocks slid horribly into that fall, financials were perking up and they formed a classic positive divergence. It would have been an excellent clue that investors should be using lower prices to load up on shares.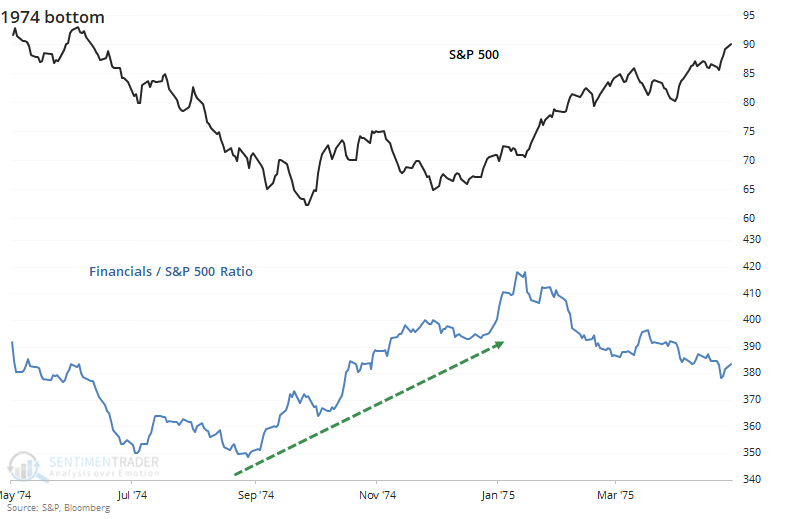
The banking crisis in 1932 showed a somewhat similar pattern to a couple other bottoms. During the initial panic and slide lower at the ultimate low, there was no positive clue from financials. But after the initial bounce off the low and subsequent test later that year, financials were showing decent relative strength.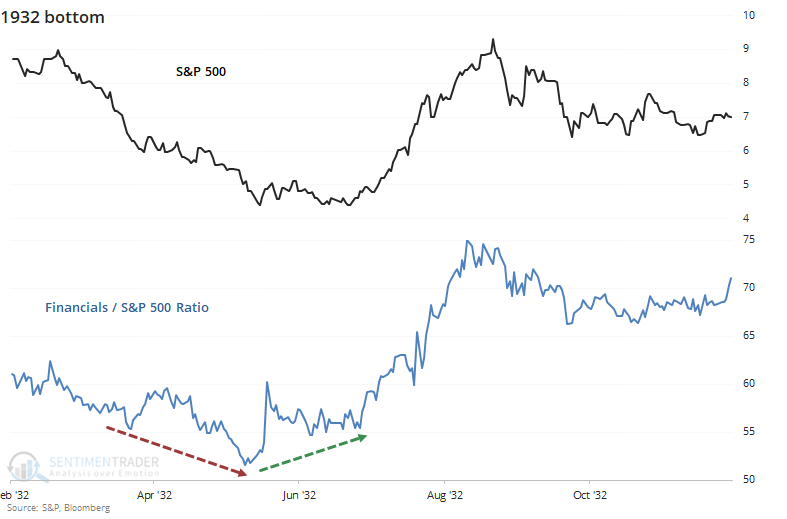
During the initial crash in 1929 and subsequent after-shocks, there was no positive clue from financials. They continued to hit new lows relative to the broader market the whole way, including at the major low.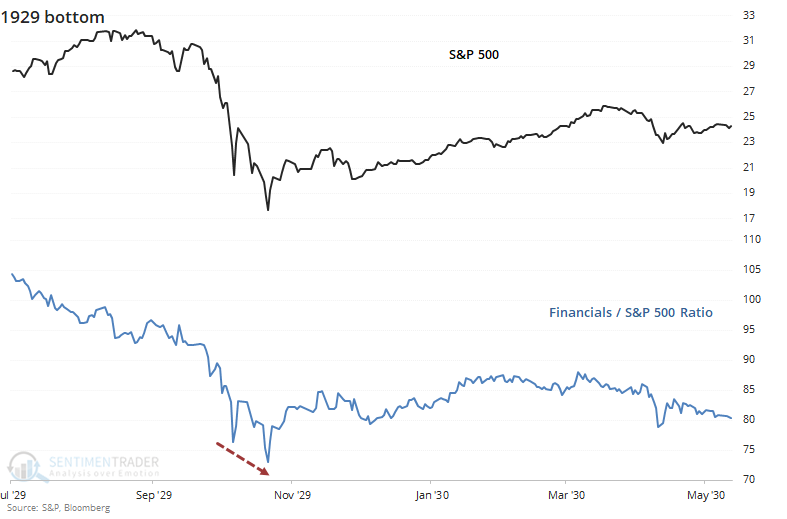
Overall, there is nothing here to suggest that an investor needs to look for financials as a source of relative strength ahead of a low, major or minor, in the broader market.