Data &
Technology
Research
Reports
Report Solutions
Reports Library
Actionable
Strategies
Free
Resources
Simple Backtest Calculator
Simple Seasonality Calculator
The Kelly Criterion Calculator
Sentiment Geo Map
Public Research Reports
Free Webinar
Pricing
Company
About
Meet Our Team
In the News
Testimonials
Client Success Stories
Contact
Log inLoginSign up
< BACK TO ALL REPORTS

Looking at the last week of a big quarter

Jason Goepfert
2020-06-23
This quarter has been among the very best in market history. Since 1928, this currently ranks in the top 10 of all quarters. When we look at how the S&P has fared up to the last week of each quarter, we can see a negative correlation with the return during the last week, potentially a result of rebalancing activity.

We're nearing the last week of the quarter, and what a quarter it has been. The S&P 500 is on track for a nearly 20% gain, ranking in the top 10 out of 369 quarters since 1928.

We've looked at the concept of window dressing in the past, with inconclusive results. This is the theory that since stocks have done so well during the quarter, funds have an incentive to add to their stock positions before quarter-end, in order to show investors that they're invested.

Like most things market-related, it sounds good in theory, but empirical evidence is almost nonexistent. It might occur in some individual stocks, but for the market as a whole, it's mostly a non-factor.

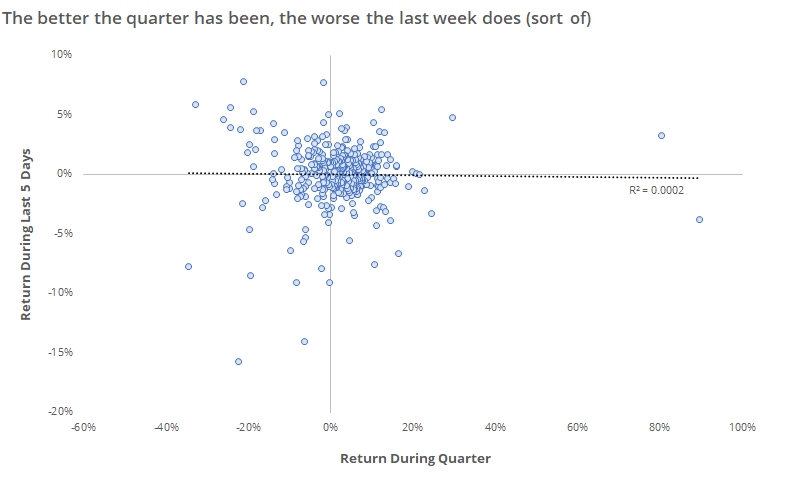
The chart below shows every quarter since 1928. The x-axis is the S&P's return for the quarter, up to the last week of the quarter. The y-axis is the return during that last week of the quarter.

The correlation between them is essentially zero. It's slightly negative but not enough to consider it any kind of edge.

That includes all quarters, even the meek ones. If we restrict our look to the most exceptional quarters - and this is surely one of them - then we can see a bit more of a pattern.

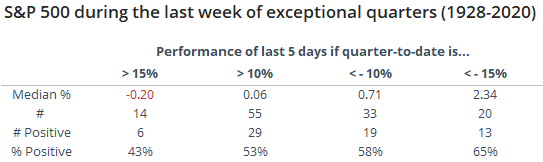
If the S&P had rallied 15% or more up to the last week of a quarter, then that last week returned a median -0.2% and was positive 43% of the time. That's fairly week given an overall positive bias during the study period. Theoretically, if investors are rotating out of stocks near the end of good quarters, then they should be rotating into bonds. And there was some evidence of that - the Bloomberg Barclays U.S. Aggregate Bond Index averaged a return of 0.4% during those weeks and was higher 81% of the time since 1989.

If the S&P had dropped 15% or more during a quarter, then there was a pretty strong bullish bias during the last week, returning a whopping 2.3% on average. That's an enormous return for only a week's worth of work. The Bloomberg bond index averaged a return of 0.2% during these weeks and was higher 64% of the time.

Given the strong rally this quarter, and the (small) inverse correlation between quarter-to-date and last-week returns, it would suggest a minor negative short-term bias for the coming week, potentially as large funds rebalance their asset allocation.

Sorry, you don't have access to this report

Upgrade your subscription plan to get access
Go to Dasboard
DATA &
TECHnologies
IndicatorEdge
‍
BackTestEdge
‍
Other Tools
‍
DataEdge API
RESEARCH
reports
Research Solution
‍
Reports Library
‍
actionable
Strategies
Trading Strategies
‍
Smart Stock Scanner
‍
FREE
RESOUrCES
Simple Backtest
Calculator
Simple Seasonality
Calculator
The Kelly Criterion
Calculator
Sentiment Geo Map
‍
Public Research Reports
‍
Free Webinar
COMPANY
‍
About
‍
Meet our Team
‍
In the News
‍
Testimonials
‍
Client Success Stories
Pricing
Bundle pricing
‍
Announcements
‍
FAQ
© 2024 Sundial Capital Research Inc. All rights reserved.
Setsail Marketing
TermsPrivacyAffiliate Program
Risk Disclosure: Futures and forex trading contains substantial risk and is not for every investor. An investor could potentially lose all or more than the initial investment. Risk capital is money that can be lost without jeopardizing ones’ financial security or life style. Only risk capital should be used for trading and only those with sufficient risk capital should consider trading. Past performance is not necessarily indicative of future results.

Hypothetical Performance Disclosure: Hypothetical performance results have many inherent limitations, some of which are described below. No representation is being made that any account will or is likely to achieve profits or losses similar to those shown; in fact, there are frequently sharp differences between hypothetical performance results and the actual results subsequently achieved by any particular trading program. One of the limitations of hypothetical performance results is that they are generally prepared with the benefit of hindsight. In addition, hypothetical trading does not involve financial risk, and no hypothetical trading record can completely account for the impact of financial risk of actual trading. for example, the ability to withstand losses or to adhere to a particular trading program in spite of trading losses are material points which can also adversely affect actual trading results. There are numerous other factors related to the markets in general or to the implementation of any specific trading program which cannot be fully accounted for in the preparation of hypothetical performance results and all which can adversely affect trading results.

Testimonial Disclosure: Testimonials appearing on this website may not be representative of other clients or customers and is not a guarantee of future performance or success.