
Long-term trends dwindle, with the S&P 500 hovering near a high

Key points:
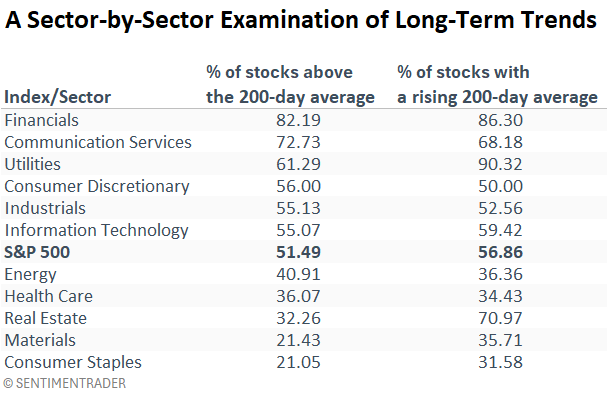
- Two measures of long-term trend conditions for S&P 500 stocks indicate dwindling participation
- Similar breadth backdrops suggest the large-cap index could struggle in the next few months
"Markets are strongest when they are broad and weakest when they narrow to a handful of blue-chip names" - Bob Farrell
Bob Farrell's 7th rule in his 10 rules for investing is undoubtedly being tested as market breadth deteriorates. Yet, the S&P 500 remains resilient, hovering just under its record high. Said another way, the generals are holding steady while the soldiers falter.
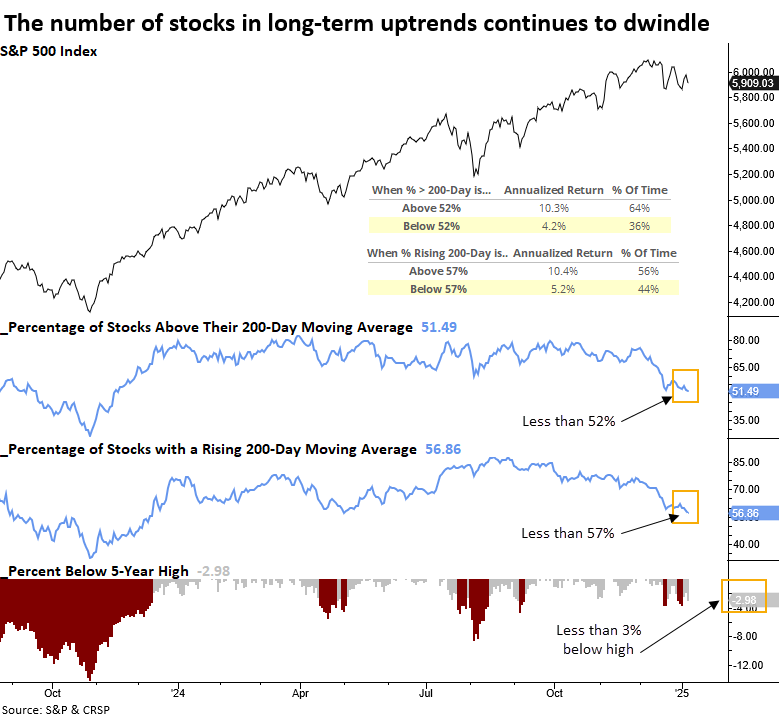
The latest indicator highlighting the dwindling participation comes from the percentage of stocks in the S&P 500 trading above their 200-day average. For only the 8th time since 1928, fewer than 52% of the members held above their long-term averages as the S&P 500 resided within 3% of a high.
As a result of stocks closing below their long-term average for an extended period, fewer than 57% of S&P 500 members maintain a rising 200-day average, the weakest level since December 2023.
As shown in the chart below, when fewer than 52% of stocks are above their 200-day average or fewer than 57% exhibit a rising 200-day average, annualized S&P 500 returns decline to 4.2% and 5.2%, respectively, well below the returns seen above these levels.
Comparable market breadth conditions preceded negative returns
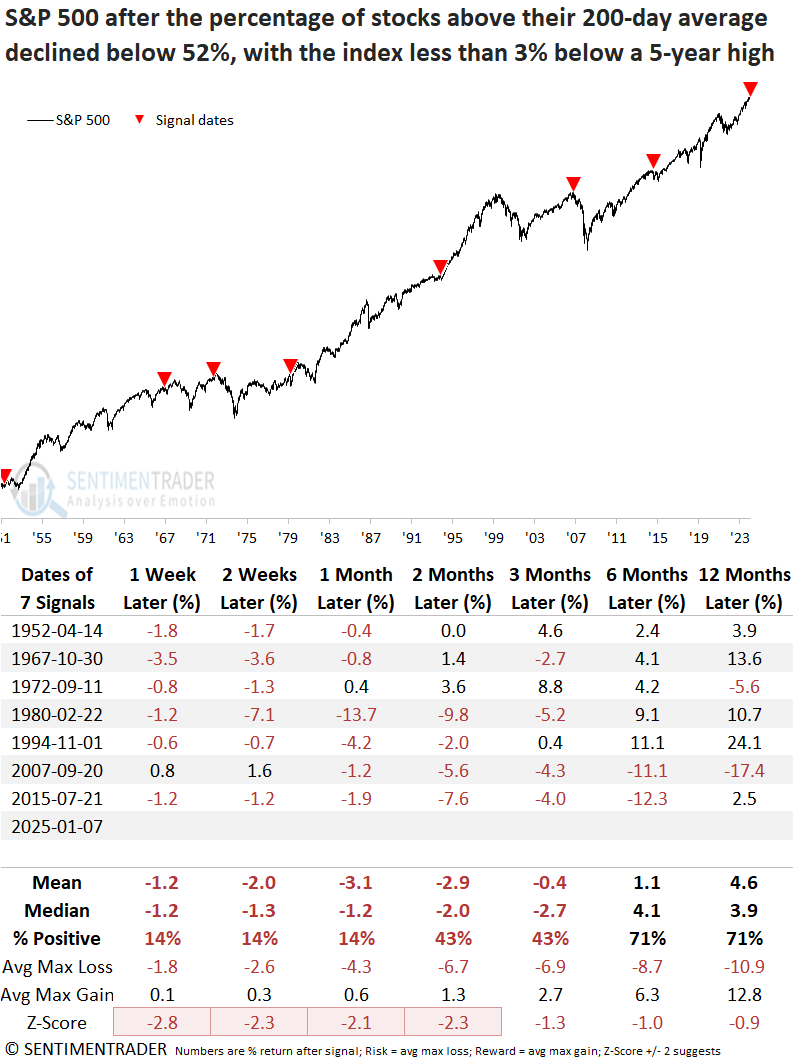
On the rare occasions when fewer than 52% of S&P 500 stocks traded above their 200-day average, while the index remained within 3% of a 5-year high, the world's most benchmarked index tended to struggle over a medium-term horizon. Moreover, the risk was elevated in the initial month, with the index falling 86% of the time.
Over the subsequent six months, the average maximum loss surpassed the maximum gain in each interval, reflecting a period of elevated risk.
When I raised the threshold from 52% to 53%, the study found one more precedent. That signal occurred in May 1929.
Flipping the average from rising to falling requires time or a significant deviation
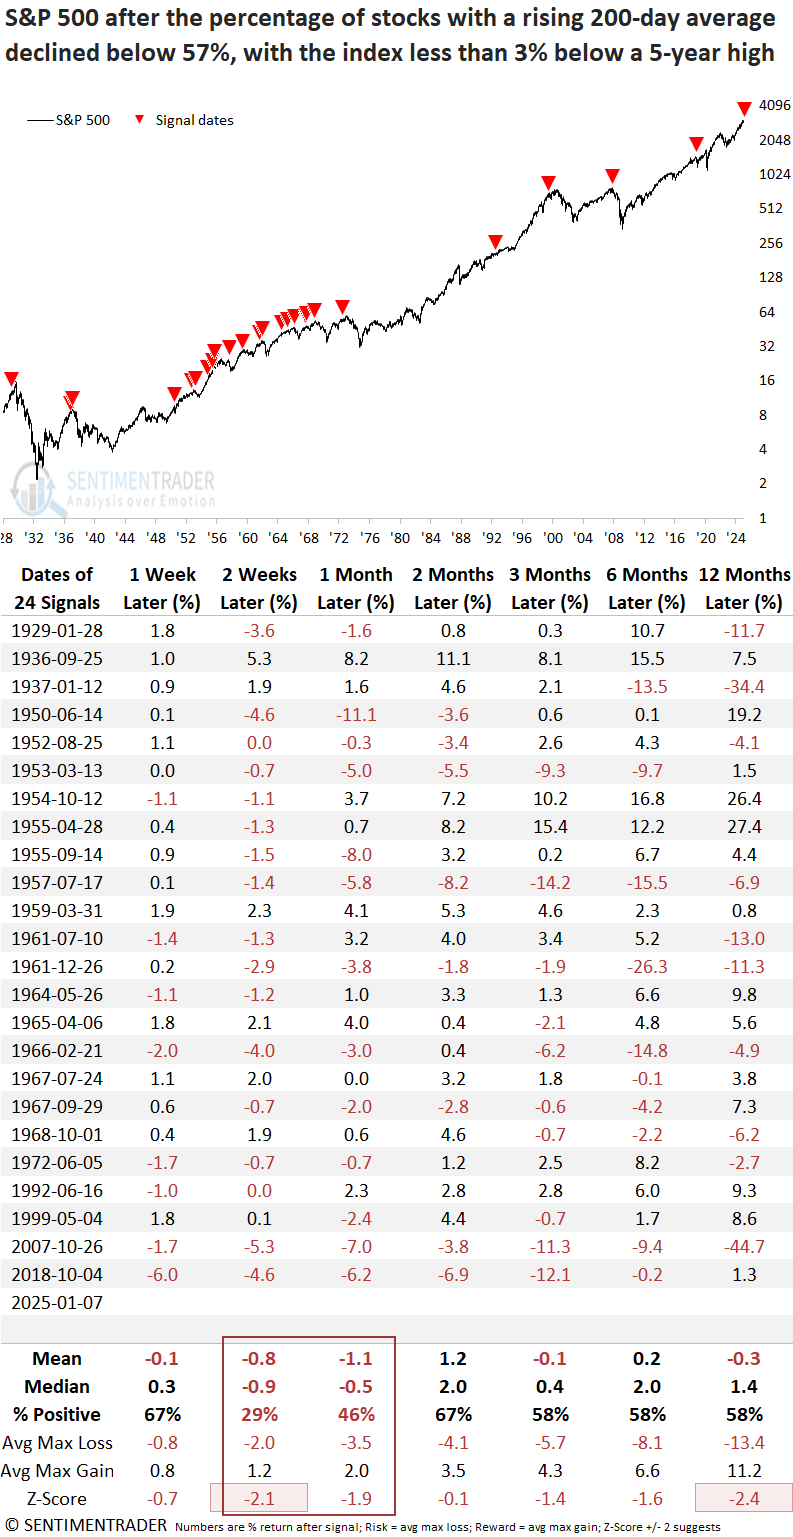
A scenario where less than 57% of S&P 500 stocks displayed a rising 200-day average, combined with the index being within 3% of a 5-year high, frequently preceded declines in the large-cap index over the following two to four weeks. From a long-term perspective, this setup delivered below-average returns and often coincided with significant market peaks.
Between 1950 and 1972, a significant number of precedents emerged during a period of notable index concentration, with GM alone representing 10% of the benchmark for most of this time. Rising interest rates and inflation also characterized this era, two business cycle factors that typically influence stock participation trends.
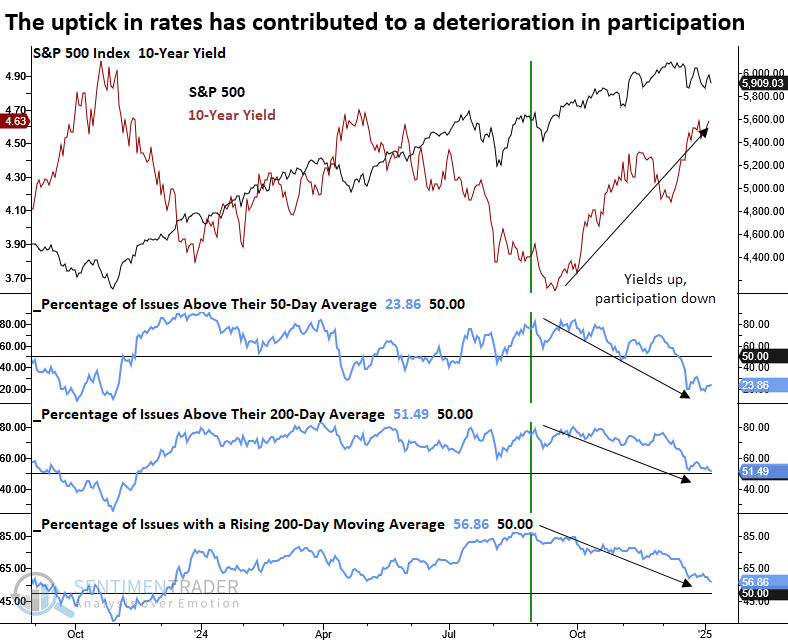
One factor influencing stock market participation
The upward shift in the 10-year Treasury yield, a critical metric for lending rates, has undoubtedly impacted participation, particularly taking a toll on rate-sensitive groups.
I suspect the direction of yields will determine whether the current consolidation remains shallow or evolves into a more significant correction.
A deteriorating market breadth backdrop
Although the participation problem remains concentrated in defensive and commodity-oriented groups, the weakness is seeping into other sectors, such as Consumer Discretionary, where only half of its members now maintain a rising 200-day average.
Homebuilders, an interest rate-sensitive group within the discretionary sector, exemplify the deteriorating backdrop, having fallen 26% since their September 2024 peak.
What the research tells us...
Two indicators that measure long-term trends, the percentage of stocks above their 200-day average and the percentage of stocks with a rising 200-day average, show fewer and fewer stocks participating in the uptrend, a scenario that typically results in an unfavorable outlook over the next few months and potentially something more meaningful. While we never want to place too much emphasis on any one indicator, I suspect the 10-year Treasury yield might hold the key to understanding the outcome of this consolidation- falling yields would likely accompany an upside breakout, whereas a downside break in stocks suggests rising yields. Consolidations are complicated to recognize and even more challenging to trade. Patience is critical, and risk management is imperative.