Data &
Technology
Research
Reports
Report Solutions
Reports Library
Actionable
Strategies
Free
Resources
Simple Backtest Calculator
Simple Seasonality Calculator
The Kelly Criterion Calculator
Sentiment Geo Map
Public Research Reports
Free Webinar
Pricing
Company
About
Meet Our Team
In the News
Testimonials
Client Success Stories
Contact
Log inLoginSign up
< BACK TO ALL REPORTS

Long-Term Bears; Russell 2000 Bear Market; S&P Drops On Friday/Monday; Spike In 52-Week Lows

Jason Goepfert
2018-12-18
null

This is an abridged version of our Daily Report.

Long-term bears

Building on what we looked at last week, we take a longer-term, multi-year look at prior bear markets, including their median loss and standard deviations. We also look at returns following major peaks in Consumer Confidence.

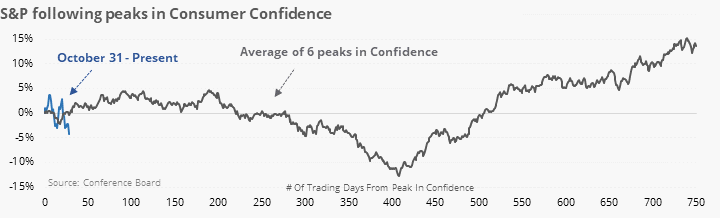
The conclusion doesn’t really change. While it’s sexy to hype up a repeat of 2008, that was a once-in-multiple-generation worldwide financial crisis. The vast majority of bear markets are much less dramatic, and the vast majority of damage had typically already been done by now. There are outliers to the downside – that red line is scary – but there are also outliers to the upside.

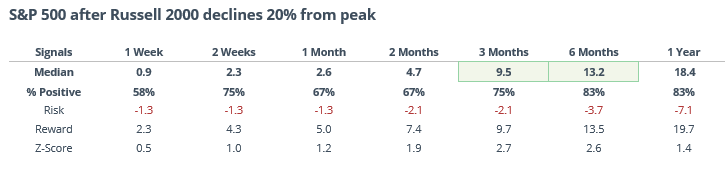
A not-so-leading index

The Russell 2000 has dropped 20% from its peak. No matter what it’s called, it’s a big decline, but it typically didn’t lead to consistent losses going forward for the Russell. For the S&P, those big declines in small-caps led to significantly positive returns over the medium-term.

Bad bookend

The S&P lost more than 1.5% on both Friday and Monday, leading to a new one-year low. Such heavy losses bookending a weekend have occurred near some of market’s major turning points.

And more than 25% of NYSE and Nasdaq securities dropped to a 52-week low on Monday. Almost all of the losses occurred in 2008. In fact, all of them did over the next six months. If we just exclude 2008 from the results and make no other changes, then we get the following. It suggests that outside of a worldwide financial crisis, such a huge spike in wholesale selling pressure led to excellent returns going forward.

New feature

Eric has added the ability to shade charts with bear markets and recessions. There is a button under every chart to do so. Also, it’s now a choice in the Backtest Engine under Market Environment. If you choose to do so, you can restrict any test to ONLY include bull or bear markets, recessions or non-recessions. This is a great tool to give you more information on how indicators perform during different environments.

DATA &
TECHnologies
IndicatorEdge
‍
BackTestEdge
‍
Other Tools
‍
DataEdge API
RESEARCH
reports
Research Solution
‍
Reports Library
‍
actionable
Strategies
Trading Strategies
‍
Smart Stock Scanner
‍
FREE
RESOUrCES
Simple Backtest
Calculator
Simple Seasonality
Calculator
The Kelly Criterion
Calculator
Sentiment Geo Map
‍
Public Research Reports
‍
Free Webinar
COMPANY
‍
About
‍
Meet our Team
‍
In the News
‍
Testimonials
‍
Client Success Stories
Pricing
Bundle pricing
‍
Announcements
‍
FAQ
© 2024 Sundial Capital Research Inc. All rights reserved.
Setsail Marketing
TermsPrivacyAffiliate Program
Risk Disclosure: Futures and forex trading contains substantial risk and is not for every investor. An investor could potentially lose all or more than the initial investment. Risk capital is money that can be lost without jeopardizing ones’ financial security or life style. Only risk capital should be used for trading and only those with sufficient risk capital should consider trading. Past performance is not necessarily indicative of future results.

Hypothetical Performance Disclosure: Hypothetical performance results have many inherent limitations, some of which are described below. No representation is being made that any account will or is likely to achieve profits or losses similar to those shown; in fact, there are frequently sharp differences between hypothetical performance results and the actual results subsequently achieved by any particular trading program. One of the limitations of hypothetical performance results is that they are generally prepared with the benefit of hindsight. In addition, hypothetical trading does not involve financial risk, and no hypothetical trading record can completely account for the impact of financial risk of actual trading. for example, the ability to withstand losses or to adhere to a particular trading program in spite of trading losses are material points which can also adversely affect actual trading results. There are numerous other factors related to the markets in general or to the implementation of any specific trading program which cannot be fully accounted for in the preparation of hypothetical performance results and all which can adversely affect trading results.

Testimonial Disclosure: Testimonials appearing on this website may not be representative of other clients or customers and is not a guarantee of future performance or success.