Data &
Technology
Research
Reports
Report Solutions
Reports Library
Actionable
Strategies
Free
Resources
Simple Backtest Calculator
Simple Seasonality Calculator
The Kelly Criterion Calculator
Sentiment Geo Map
Public Research Reports
Free Webinar
Pricing
Company
About
Meet Our Team
In the News
Testimonials
Client Success Stories
Contact
Log inLoginSign up
< BACK TO ALL REPORTS

Leverage Drops While Stocks Soar to Record Highs

Jason Goepfert
2021-08-25
Despite stocks closing the month at a record high, investors pulled back on margin debt, and their cash levels plunged.

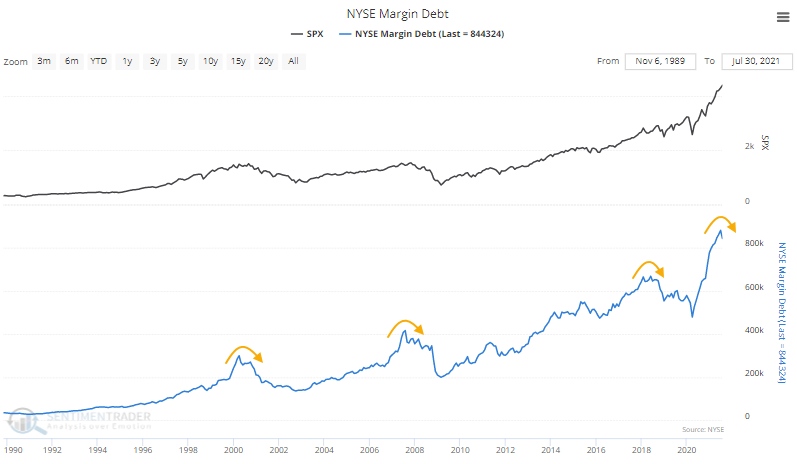
People have been worried about the growth in margin debt for at least the last 6 years. There was no empirical reason to be worried until maybe this spring when the year-over-year change skyrocketed. And that worry was unfounded anyway, as the S&P 500 is sitting at all-time highs.

Curiously, even as the S&P has moved to new high after new high, investors have pulled back on the amount they're borrowing against their stock holdings. The latest figures, aggregating customer data through July, shows that Margin Debt dropped from record levels.

NYSE margin debt

Margin debt more or less ebbs and flows with stock prices. So it's fairly unusual to see margin debt drop as stocks march to continual record highs. The table below shows that this is one of the largest-ever drops in debt during a month when the S&P hit a new high (dates in the table are advanced one month to account for reporting lags).

Investors pulled back on debt, but their cash cushion dropped even more. The total dollar value of Free Credits - cash available to brokerage account holders to withdraw - plunged by one of the largest degrees in 70 years in July.

If cash drops more than debt, then the Available Cash figure, a kind of "net worth" for investors, will decline. And so, in July, it fell yet again to another record low.


What else we're looking at

  • What happens to the S&P 500 after big drops in margin debt and free credits
  • What a near-record low in Available Cash means for forward returns
  • How watching a certain currency can give a big clue to commodity markets
  • A trading signal using Bollinger Bands, within context
  • What happens after Amazon underperforms the broader market like it has lately

Stat box

For the 1st time in 30 years, more than 75% of volume on the NYSE has flowed into advancing securities for three consecutive days while the S&P 500 closed at a new high.

Etcetera

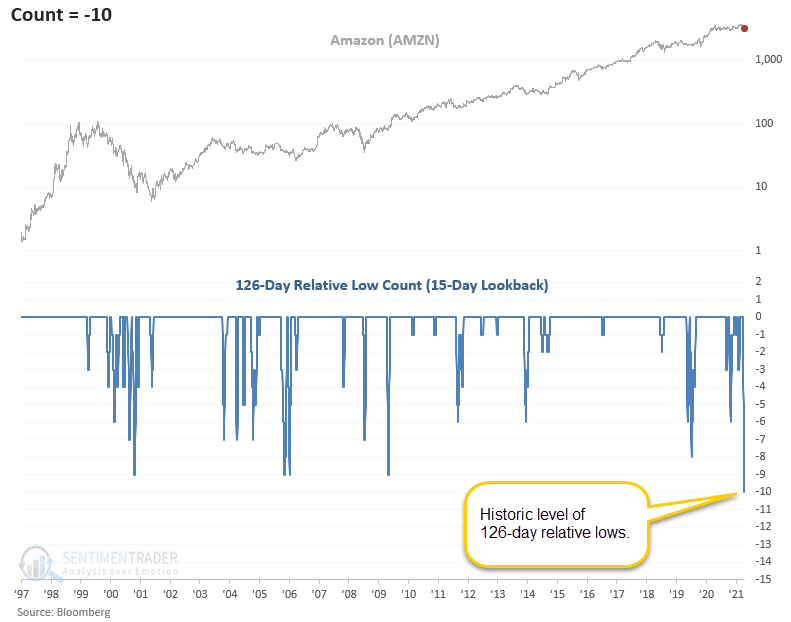
Poor delivery. Amazon's stock price has lagged the broader market by the largest degree in its history as a public company. Over the past three weeks, it has set 10 six-month lows relative to the S&P 500.

amazon amzn relative low

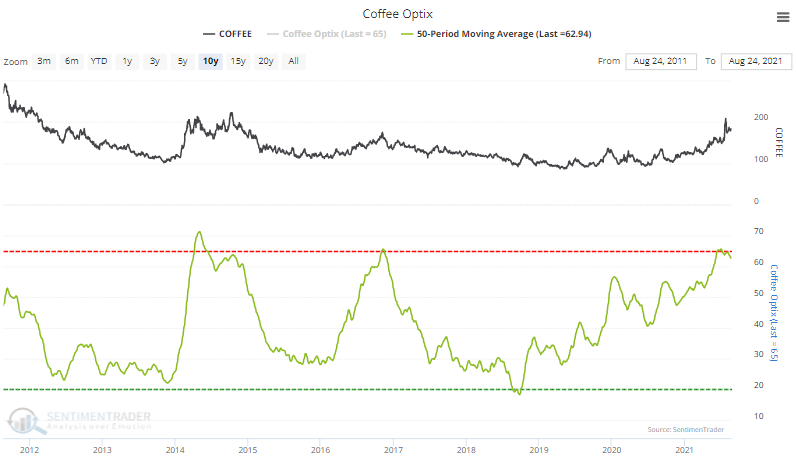
In need of a pick-me-up. A 50-day average of the Optimism Index for coffee is rolling over from extreme optimism for the 3rd time in the past decade.

coffee sentiment

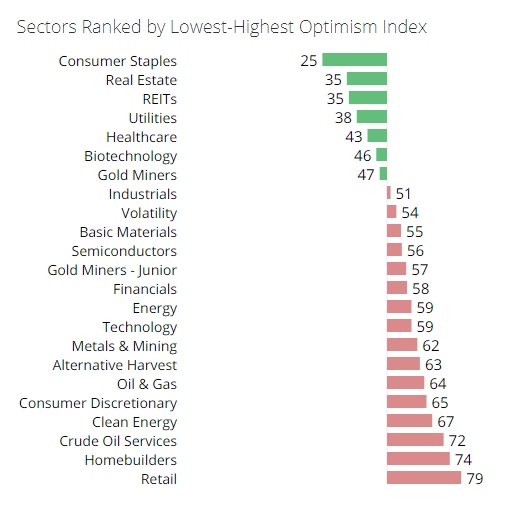
Unstable staples. Traders are the least optimistic about short-term prospects for Consumer Staples stocks, while having the most confidence in Retail and Homebuilders.

optimism index table

DATA &
TECHnologies
IndicatorEdge
‍
BackTestEdge
‍
Other Tools
‍
DataEdge API
RESEARCH
reports
Research Solution
‍
Reports Library
‍
actionable
Strategies
Trading Strategies
‍
Smart Stock Scanner
‍
FREE
RESOUrCES
Simple Backtest
Calculator
Simple Seasonality
Calculator
The Kelly Criterion
Calculator
Sentiment Geo Map
‍
Public Research Reports
‍
Free Webinar
COMPANY
‍
About
‍
Meet our Team
‍
In the News
‍
Testimonials
‍
Client Success Stories
Pricing
Bundle pricing
‍
Announcements
‍
FAQ
© 2024 Sundial Capital Research Inc. All rights reserved.
Setsail Marketing
TermsPrivacyAffiliate Program
Risk Disclosure: Futures and forex trading contains substantial risk and is not for every investor. An investor could potentially lose all or more than the initial investment. Risk capital is money that can be lost without jeopardizing ones’ financial security or life style. Only risk capital should be used for trading and only those with sufficient risk capital should consider trading. Past performance is not necessarily indicative of future results.

Hypothetical Performance Disclosure: Hypothetical performance results have many inherent limitations, some of which are described below. No representation is being made that any account will or is likely to achieve profits or losses similar to those shown; in fact, there are frequently sharp differences between hypothetical performance results and the actual results subsequently achieved by any particular trading program. One of the limitations of hypothetical performance results is that they are generally prepared with the benefit of hindsight. In addition, hypothetical trading does not involve financial risk, and no hypothetical trading record can completely account for the impact of financial risk of actual trading. for example, the ability to withstand losses or to adhere to a particular trading program in spite of trading losses are material points which can also adversely affect actual trading results. There are numerous other factors related to the markets in general or to the implementation of any specific trading program which cannot be fully accounted for in the preparation of hypothetical performance results and all which can adversely affect trading results.

Testimonial Disclosure: Testimonials appearing on this website may not be representative of other clients or customers and is not a guarantee of future performance or success.