
Let's Get Crude

There are three things we know for sure about crude oil:
- The price of a barrel of oil rises and falls based on a variety of supply and demand factors
- In order to drill for oil, you have to have equipment in place
- Like everything else, demand for oil can reach overly high and/or overly low extremes
One way to keep track of "where we are" is to see how much drilling is actually being done. OK, I will admit this sounds like a segue into some pretty boring fundamental data. But we can actually achieve the desired result without drilling too deeply (sorry, it's just my nature).
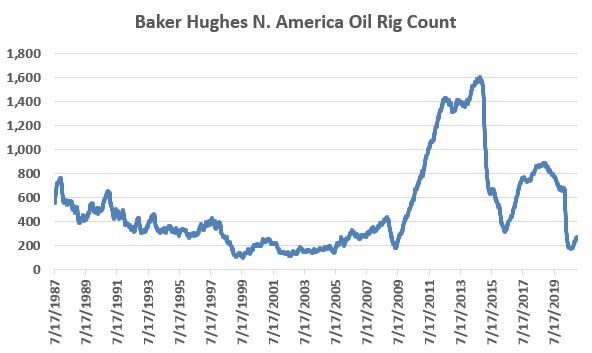
Baker Hughes publishes the number of oil rigs they have operating in North America every week. That data series since 1987 appears below.
Baker Hughes North American Oil Rig Count
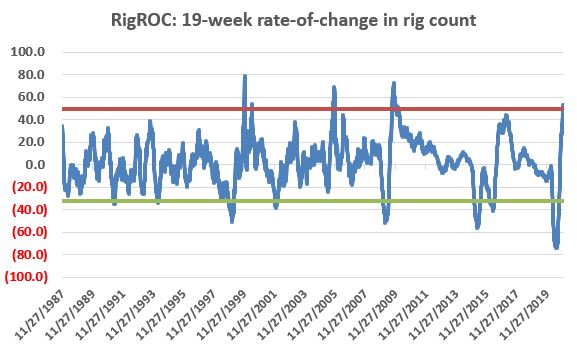
The data seems pretty erratic at first glance; however, the chart below displays the 19-week percentage rate-of-change in the number of rigs deployed. For lack of a better term, we will refer to this as "RigROC". Suddenly the high and low extremes are a little easier to identify. We have highlighted the +50% and -32% levels on the chart below
19-week rate-of-change in rig count
Do extreme high or low RigROC readings offer any useful information regarding the trend for crude oil? Here is another question (this one rhetorical), "Would I ask the question if the answer was "No"?
As it turns out, extreme high and low reading in RigROC seem to be similar to new highs in the stock market. When the number of new highs in the stock market is extremely low it is typically bullish, as this often highlights a deeply oversold market that is due for a rally. Interestingly, a large number of new highs is typically also bullish for the stock market as it signals strong, bullish participation in a market advance.
Extreme readings in RigROC appear to offer something similar – extremely low readings suggest an oversold oil market that is due for a rally, and extremely high readings appear to highlight a "surging" oil market with at least a little bit of staying power.
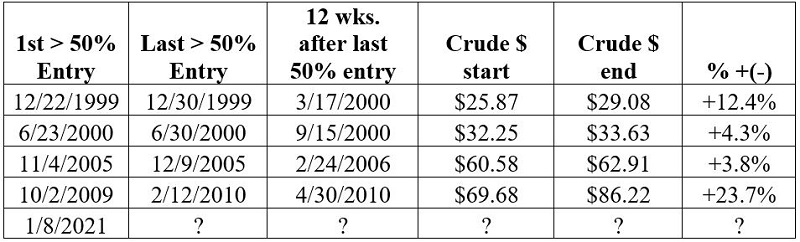
Let’s look at the numbers. Let’s first look at the price action of crude oil following RigROC readings of +50% or higher.
NOTE #1: for all results that follow I use a one-week lag between rig data reading and an actual signal. So, if RigROC reaches an extreme level when the data comes out this week (the number typically – but not always – comes out on a Wednesday), then the purported "favorable period" begins at the close on Friday of the following week.
NOTE #2: The results that follow are hypothetical and are calculated using a continuous futures contract which may or may not match what a trader would have actually experienced in real-world trading. Also, no slippage or commissions are deducted from results. The results displayed are intended ONLY to highlight the overall nature of returns and the relative usefulness of the indicator, and NOT actual trading results.
The test:
- If the RigROC last week was >= +50% then buy crude oil at the end of this week and hold for 12 weeks
- Any subsequent RigROC readings above 50 extend the holding period another 12 weeks
The table below shows the performance of crude oil following previous RigROC readings of +50% or more.
Crude Oil Price Data source: ProfitSource by HUBB, ticker CL-SPOTV
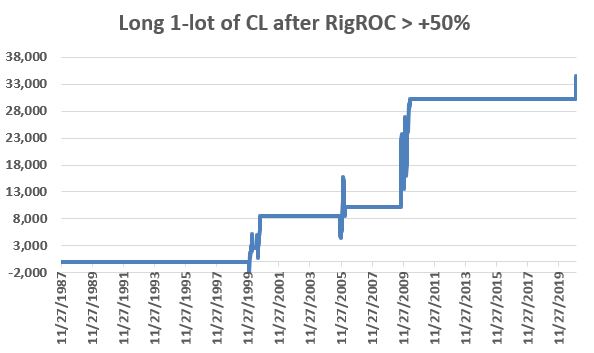
Certainly a very small sample size over 33 years of data. Still, it should be noted that a +50% 19-week increase in the number of oil rigs deployed is simply a rare occurrence. What is important to note is whether the results that follow such a rare occurrence are consistent or not.
The chart below shows the performance in chart form of holding long a 1-lot position in crude oil futures (each $1 movement in the price of crude oil = +(-) $1,000 in futures contract value) only during the periods listed above.
RigROC closed the week of 12/24/2021 at +53.5%. So, a new signal occurred at the close on 12/31/2020. For the week of 1/8/2021, RigROC was again above +50%. If no additional +50% readings occur then the "favorable period" will expire in 12 weeks on 4/9/2021.
The Other Side of the Equation
Now let’s look at the price action of crude oil following RigROC readings of -32% or below (NOTE: The same 1-week lag rule between RigROC extreme reading and the time we start tracking crude oil applies here).
The test:
- If the RigROC last week was <= -32% then buy crude oil at the end of this week and hold for 12 weeks
- Any subsequent RigROC readings below -32% extend the holding period another 12 weeks
The table below shows the performance of crude oil following previous RigROC readings of -32% or less.
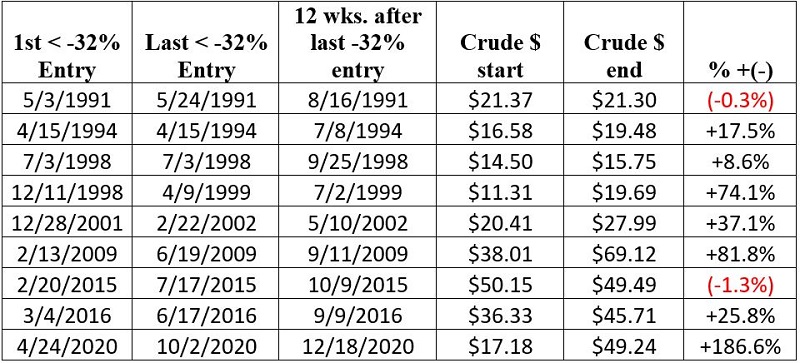
Crude Oil Price Data source: ProfitSource by HUBB, ticker CL-SPOTV
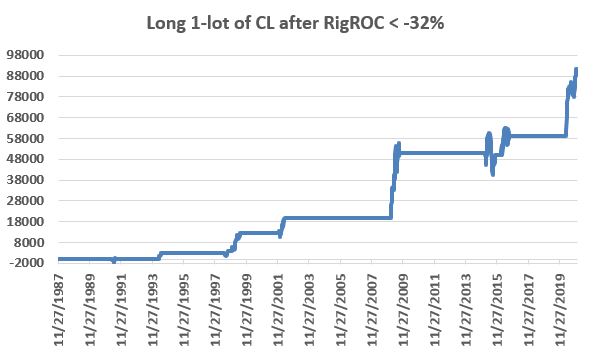
The chart below shows the performance in chart form of holding long a 1-lot position in crude oil futures (each $1 movement in the price of crude oil = +(-) $1,000 in futures contract value). Once again, results are hypothetical and are calculated using a continuous futures contract with no slippage or commission deduction.
Combining Signals
The important thing to remember is that just because RigROC rises above +50% or drops below -32% at any given point in time, there is never any guarantee that the price of crude oil will subsequently rise. Likewise, just because RigROC is not favorable at a given point in time it does not mean that crude oil is doomed to fall. In fact, it should be noted that during the bulk of the massive 2001 into 2008 rally in crude oil this indicator was neutral, with signals only in late-2001 and late-2005.
So, this seems like a good time to invoke:
Jay’s Trading Maxim #16: Between theory and reality lies a chasm a mile wide.
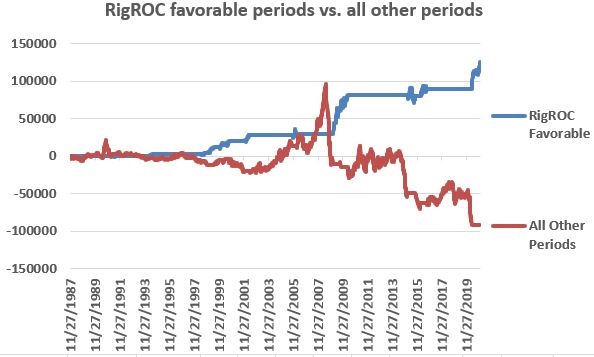
Still, to present the full picture, the chart below displays the hypothetical $ +(-) from holding long a 1-lot position in crude oil futures during all of the periods listed in the tables above (blue) versus the hypothetical $ +(-) from holding long a 1-lot position in crude oil futures during all other periods.
The table below displays the average % +(-) for crude oil for various time periods during all weeks, as well as following all weeks that saw RigROC register a reading of +50% or -32%.

The results are compelling. But beware the aforementioned chasm.