Products
SentimenTrader Trading Tools
‍
Backtest Engine
My Trading Toolkit
Correlation Analysis
Seasonality
Market Prediction
Indicators & Data API
‍
Proprietary Indicators & Charts
Market Data API
Strategies & Scanner
‍
50+ Trading Strategies
Smart Stock Scanner
Smart Option Scanner
Research Reports
‍
Research Solutions
Reports Library
Free Resources
Simple Backtest Calculator
Simple Seasonality Calculator
The Kelly Criterion Calculator
Sentiment Geo Map
Public Research Reports
Education
Sentiment Indicators
Technical Indicators
Pricing
Company
About
In the News
Testimonials
Client Success Stories
Contact
Log inLoginSign up
< BACK TO ALL REPORTS

Leading up to its recent tumble, gold shot far ahead of fundamentals

Jason Goepfert
2020-08-13
Over a 50-day span, gold rallied more than 20% while real 10-year interest rates tumbled. The two have a tight inverse relationship, but that was a very large rally for that level of decline in rates.

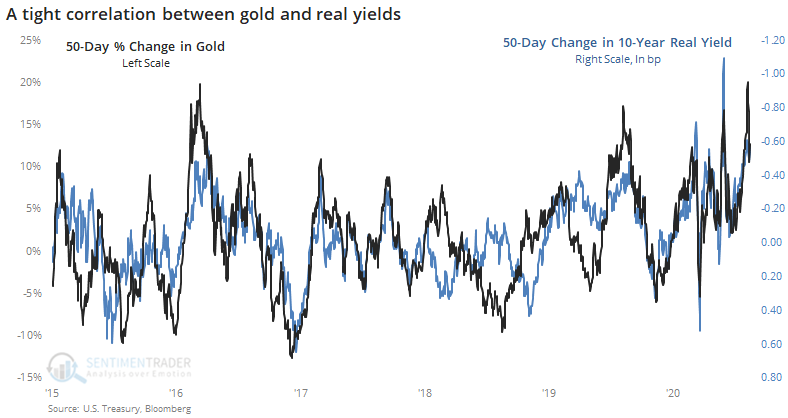
Gold had a heck of a run starting about a month ago. It not only generated a massive amount of optimism that the metal will keep rising, it was enough to partially de-couple from one of its main drivers.

As the Wall Street Journal notes, gold's gain over the past 10 weeks far outpaces the drop in real 10-year Treasury yields. There is a tight inverse correlation between the two, so as real rates dropped, gold should have rallied. It just rallied A LOT.

We always apply two questions when seeing a development like this:

  1. Is it true?
  2. So what?

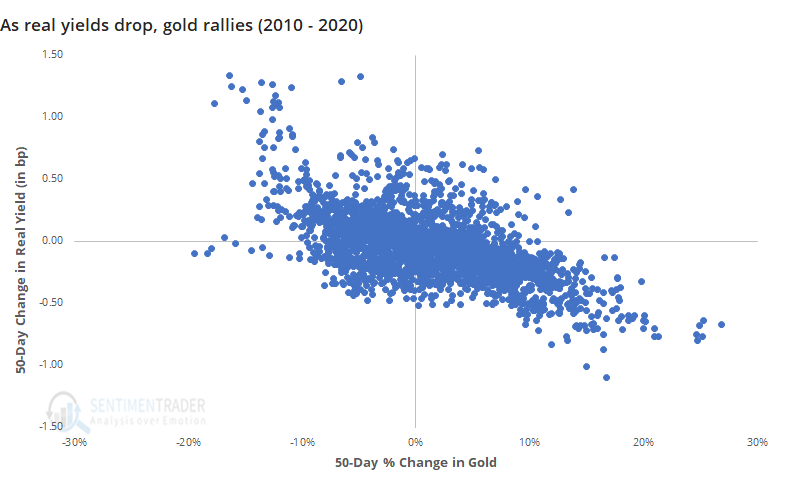
As for the first, yes, it's accurate. Over a 50-day span, gold rallied more than 20% while real rates dropped about 50 basis points. That's normal over the past decade, but it's on the higher end of jumps in the price of gold given that level of decline in real yields. For a drop of 50 or more basis points in real yield, gold has rallied a median of 13%, so the 20%+ spike is quite a bit higher than average.

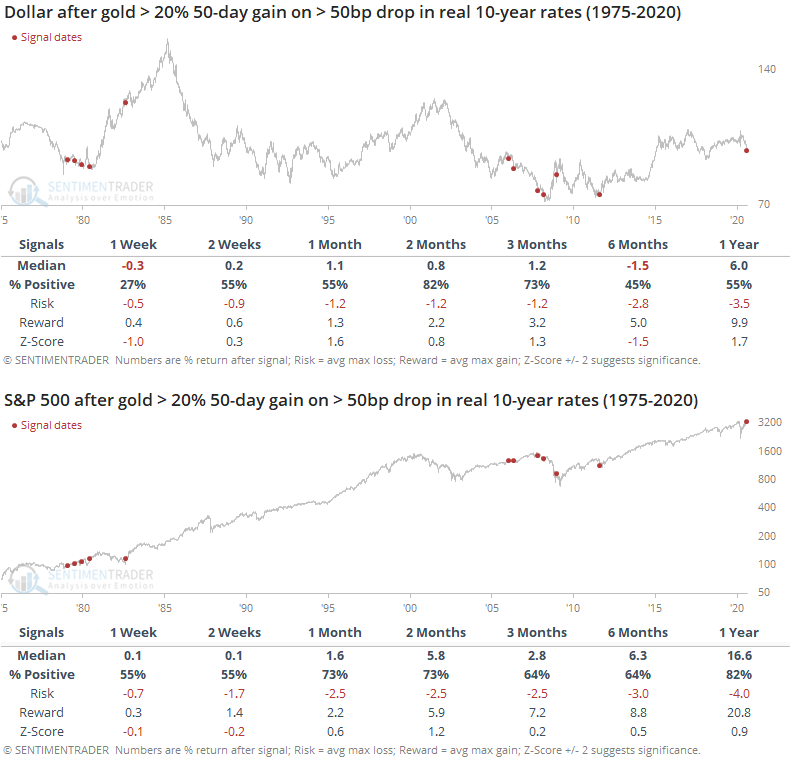
As for whether it matters, that's less certain. Below, we can see every time since 1975 when gold rallied at least 20% over a 50-day span while real yields declined 50 basis points or more.

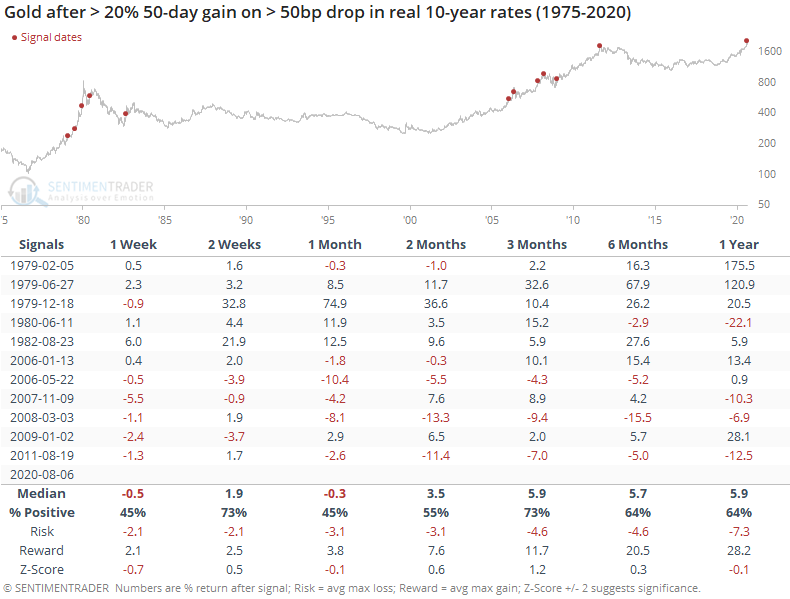
Over the next month, gold struggled a bit. It did not at all during the late 70s bull market, but during the protracted 2000s bull, gold did tend to rest over the medium-term after getting so far ahead of one of its main fundamental drivers.

As for rates, there was a modest tendency to see further weakness over the shorter-term but strength over the medium- to long-term. It was not a strong edge.

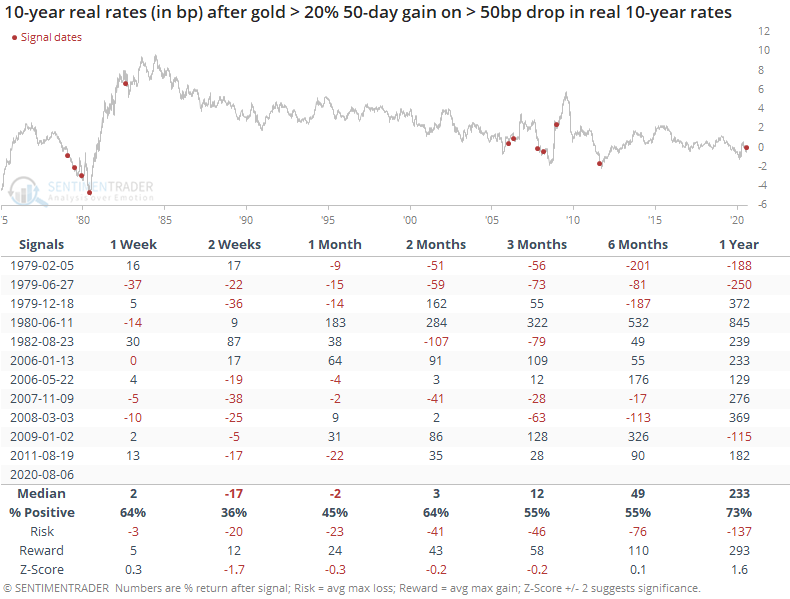
There was no strong edge in either the U.S. dollar or S&P 500, either.

Bottom line, it's interesting that gold has moved so far ahead of one of its main reasons for rallying. The extreme optimism it generated makes sense, too. There is a tendency for the metal to drop after bouts of extremes like it saw in late July, with its more recent history of decoupling from real rates being minor support to that idea as well.

PRODUCTS
SentimenTrader
Trading Tools
Indicators & Data API
‍
Strategies & Scanner
‍
Research Reports
FREE
RESOUrCES
Simple Backtest
Calculator
Simple Seasonality
Calculator
The Kelly Criterion
Calculator
Sentiment Geo Map
‍
Public Research Reports
‍
Education
Sentiment Indicators
‍
Technical Indicators
‍
Pricing
Bundle pricing
‍
FAQ
‍
Announcements
‍
COMPANY
‍
About
‍
In the News
‍
Testimonials
‍
Client Success Stories
CONTACT
‍
General Inquiries
‍
Media Inquiries
‍
Financial Professionals Inquiries
‍
© 2026 Sundial Capital Research Inc. All rights reserved.
Setsail Marketing
TermsPrivacyAffiliate Program
Risk Disclosure: The information and tools provided are for research and analytical purposes only and are not intended as investment advice. Market analysis involves uncertainty, and outcomes may differ from expectations. Users should conduct their own due diligence and consider their individual circumstances before making any financial decisions. Past performance is not necessarily indicative of future results.

Hypothetical Performance Disclosure: Hypothetical performance results have many inherent limitations, some of which are described below. No representation is being made that any account will or is likely to achieve profits or losses similar to those shown; in fact, there are frequently sharp differences between hypothetical performance results and the actual results subsequently achieved by any particular trading program. One of the limitations of hypothetical performance results is that they are generally prepared with the benefit of hindsight. In addition, hypothetical trading does not involve financial risk, and no hypothetical trading record can completely account for the impact of financial risk of actual trading. for example, the ability to withstand losses or to adhere to a particular trading program in spite of trading losses are material points which can also adversely affect actual trading results. There are numerous other factors related to the markets in general or to the implementation of any specific trading program which cannot be fully accounted for in the preparation of hypothetical performance results and all which can adversely affect trading results.

Testimonial Disclosure: Testimonials appearing on this website may not be representative of other clients or customers and is not a guarantee of future performance or success.