Data &
Technology
Research
Reports
Report Solutions
Reports Library
Actionable
Strategies
Free
Resources
Simple Backtest Calculator
Simple Seasonality Calculator
The Kelly Criterion Calculator
Sentiment Geo Map
Public Research Reports
Free Webinar
Pricing
Company
About
Meet Our Team
In the News
Testimonials
Client Success Stories
Contact
Log inLoginSign up
< BACK TO ALL REPORTS

Leading indicators trigger a buy signal for stocks
Dean Christians
2023-08-24
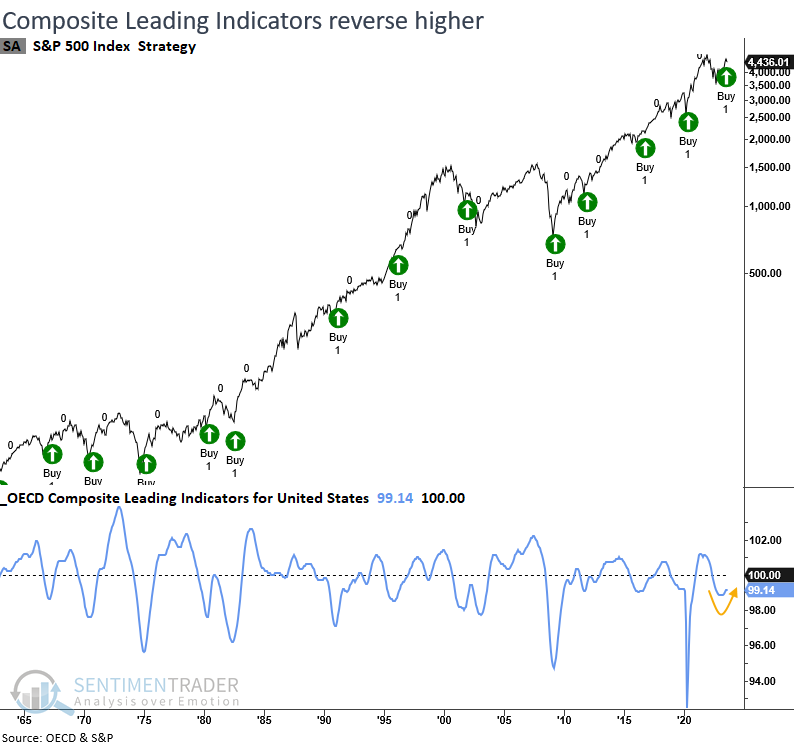
The OECD Composite Leading Indicators for the United States reversed higher from contraction territory, triggering a buy signal from the S&P 500. After similar reversals in leading indicators, the world's most benchmarked index was higher over the next two months every time.

Key points:

  • The OECD Composite Leading Indicators for the U.S. reversed higher from contraction territory 
  • Similar reversals led to extremely bullish outcomes for the S&P 500 over the next twelve months
  • Early-cycle sectors tend to outperform after leading indicators shift higher, like now

One version of leading indicators for the United States triggers a buy signal 

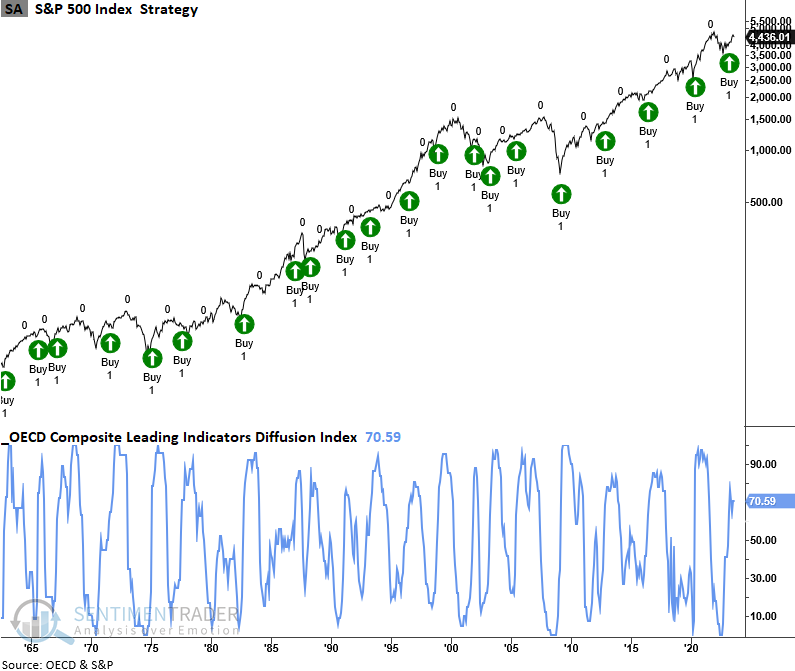
The Organization for Economic Cooperation and Development (OECD) compiles a composite of leading indicators for G20 countries. The CLIs can be aggregated into a diffusion index or used as a standalone measure for countries to identify an economic upswing that provides a bullish fundamental tailwind for stocks. 

The model I use for individual countries requires the CLI to fall into contraction territory and rise by a user-defined amount from the subsequent low. 

In the case of the United States, I require the CLI to fall below 99.5 and rise by 0.25 points from its trough, a condition that triggered a new buy signal with the most recent update from the OECD.

An upswing in the OECD Composite Leading Indicators precedes excellent returns

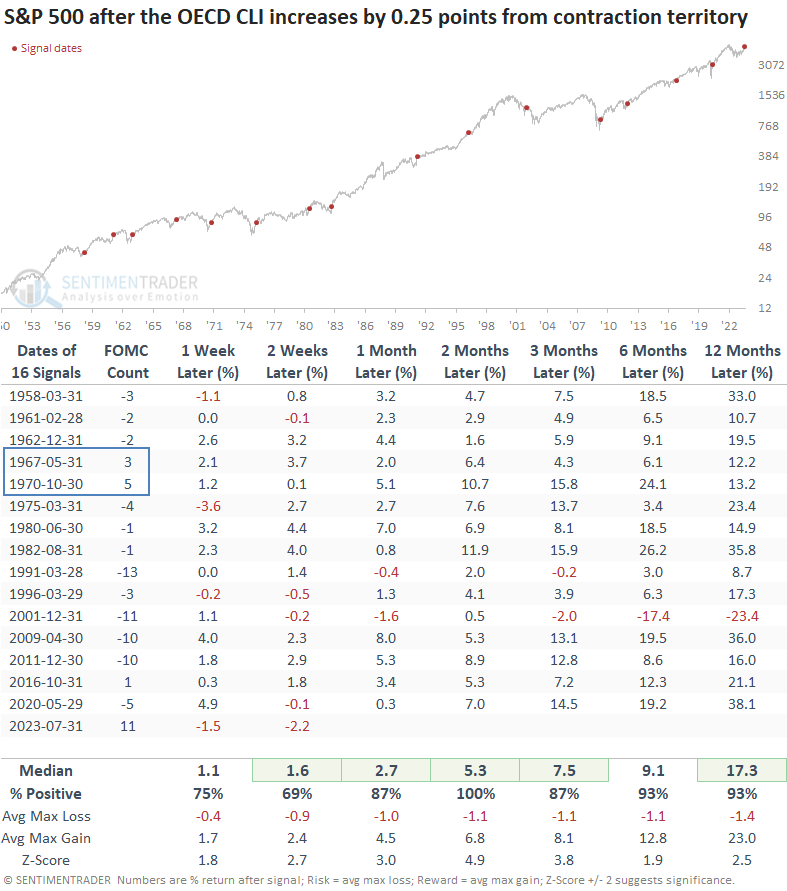
Whenever the OECD CLI for the United States falls below 99.5 and increases by 0.25 points from the subsequent low, the S&P 500 displays remarkable returns, win rates, and z-scores across all time frames. Two months later, the S&P 500 was higher every time. 

In the two previous instances when the FOMC adopted a more restrictive monetary policy stance, returns remained positive, albeit falling short of the median over the next year.
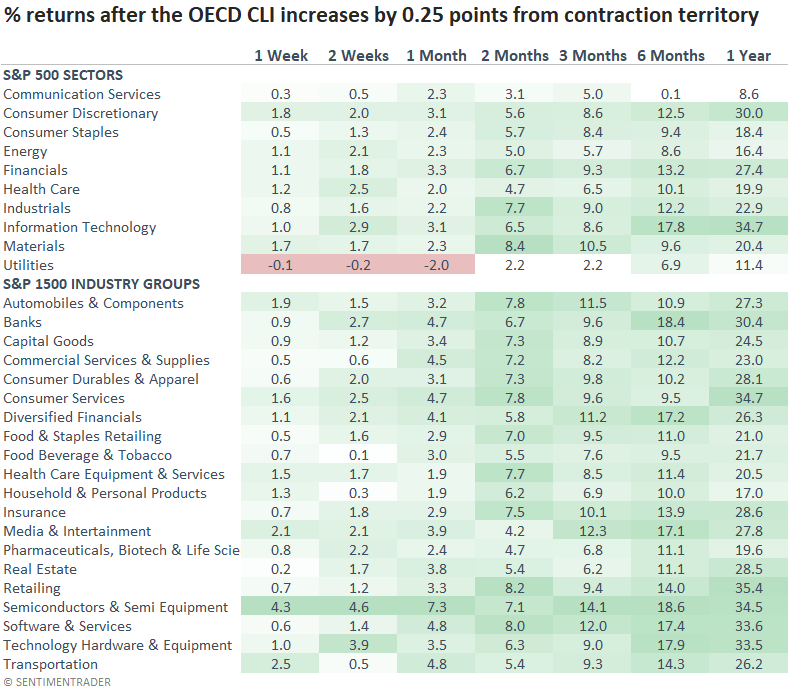
From a sector perspective, early cycle leaders like Consumer Discretionary and Technology are clear-cut winners, which aligns with current relative strength trends. 
OECD Composite Leading Indicators Diffusion Index 

The diffusion index, which aggregates individual country CLIs, continues to maintain a bullish level after triggering a buy signal in the spring.
What the research tells us...

When forecasting the macroeconomic backdrop, I rely most on the stock market for my outlook. Price leads fundamentals. As a secondary tool, I depend on leading economic indicators. One such measure from the OECD reversed higher from contraction territory, triggering a buy signal for stocks in the United States. After similar alerts, the S&P 500 displayed excellent returns and win rates bolstered by an advantageous fundamental backdrop. If this time is different, it's likely due to the delayed impact of a restrictive monetary policy stance. 

Sorry, you don't have access to this report

Upgrade your subscription plan to get access
Go to Dasboard
DATA &
TECHnologies
IndicatorEdge
‍
BackTestEdge
‍
Other Tools
‍
DataEdge API
RESEARCH
reports
Research Solution
‍
Reports Library
‍
actionable
Strategies
Trading Strategies
‍
Smart Stock Scanner
‍
FREE
RESOUrCES
Simple Backtest
Calculator
Simple Seasonality
Calculator
The Kelly Criterion
Calculator
Sentiment Geo Map
‍
Public Research Reports
‍
Free Webinar
COMPANY
‍
About
‍
Meet our Team
‍
In the News
‍
Testimonials
‍
Client Success Stories
Pricing
Bundle pricing
‍
Announcements
‍
FAQ
© 2024 Sundial Capital Research Inc. All rights reserved.
Setsail Marketing
TermsPrivacyAffiliate Program
Risk Disclosure: Futures and forex trading contains substantial risk and is not for every investor. An investor could potentially lose all or more than the initial investment. Risk capital is money that can be lost without jeopardizing ones’ financial security or life style. Only risk capital should be used for trading and only those with sufficient risk capital should consider trading. Past performance is not necessarily indicative of future results.

Hypothetical Performance Disclosure: Hypothetical performance results have many inherent limitations, some of which are described below. No representation is being made that any account will or is likely to achieve profits or losses similar to those shown; in fact, there are frequently sharp differences between hypothetical performance results and the actual results subsequently achieved by any particular trading program. One of the limitations of hypothetical performance results is that they are generally prepared with the benefit of hindsight. In addition, hypothetical trading does not involve financial risk, and no hypothetical trading record can completely account for the impact of financial risk of actual trading. for example, the ability to withstand losses or to adhere to a particular trading program in spite of trading losses are material points which can also adversely affect actual trading results. There are numerous other factors related to the markets in general or to the implementation of any specific trading program which cannot be fully accounted for in the preparation of hypothetical performance results and all which can adversely affect trading results.

Testimonial Disclosure: Testimonials appearing on this website may not be representative of other clients or customers and is not a guarantee of future performance or success.