
Leading indicators remain a headwind for stocks and economy

Key Points
- Conference Board Index of Leading Economic Indicators has been declining for several months
- Historically similar action has resulted in very subpar stock returns for up to two years
- The economy also shows a strong tendency to weaken following similar conditions
Leading Economic Indicators in a prolonged downtrend
The Conference Board Index of Leading Economic Indicators is a proprietary index calculated using the following 10 components: Average weekly hours in manufacturing; Average weekly initial claims for unemployment insurance; Manufacturers' new orders for consumer goods and materials; ISM® Index of New Orders; Manufacturers' new orders for nondefense capital goods excluding aircraft orders; Building permits for new private housing units; S&P 500® Index of Stock Prices; Leading Credit Index™; Interest rate spread (10-year Treasury bonds less federal funds rate); Average consumer expectations for business conditions.
The index is updated once a month. I also track the 6-month moving average of the monthly readings. To assess the trend of the data, I look to see if the following two items are trending higher or lower:
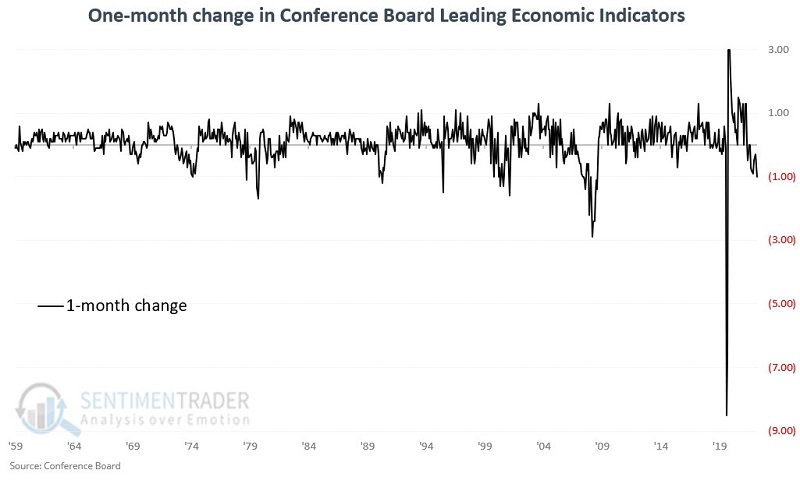
- The one-month change in the monthly reading
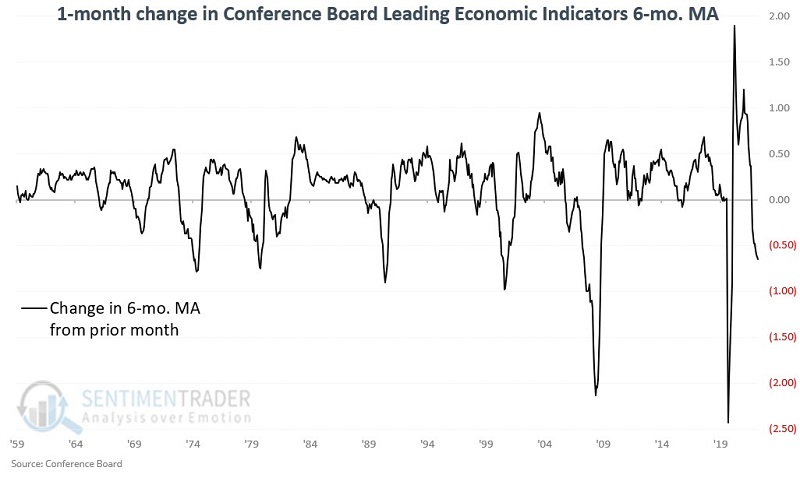
- The one-month change in the 6-month moving average
The charts below show a) the one-month change in the monthly LEI readings and b) the one-month change in the 6-month moving average of monthly LEI readings.
These data series can jump around a bit. So, for my purposes, I look for occasions when BOTH the one-month change in monthly readings AND the one-month change in the 6-month moving average have declined for at least three consecutive months. This "triple-double" level of negative persistency typically is a warning sign for both the stock market and the economy.
NOTE: I make all calculations at month-end regardless of when the latest LEI reading was released during the month.
Stock market performance after a triple-double warning
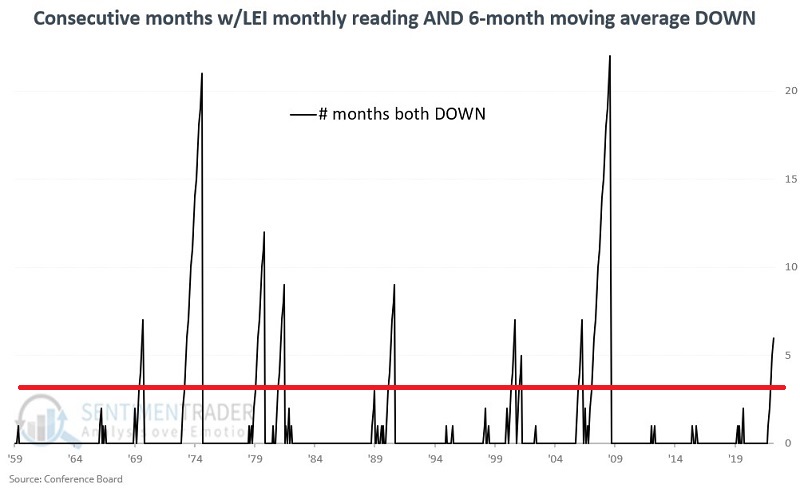
It is considered unfavorable when BOTH the monthly LEI reading AND the 6-month moving average of monthly readings decline for three consecutive months or more. The chart below displays the running total of months when both measures fell from the previous month.
Values below three (red line) are considered favorable, while values of three or above are deemed unfavorable.
The table below summarizes S&P 500 Index performance depending on whether the monthly count in the chart above is favorable or unfavorable.
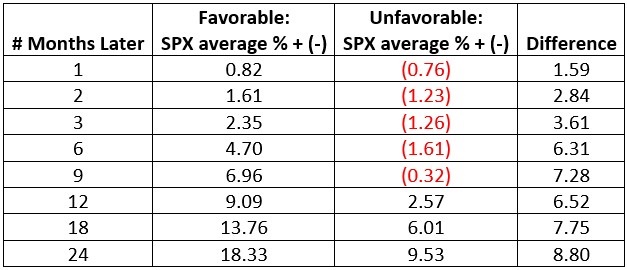
Note that S&P 500 results are lower during unfavorable periods for all time frames. Does this mean that investors should "sell everything" after three monthly declines for both the month and 6-month LEI results? Not necessarily. But it does suggest that investors might reduce their expectations - and potentially adjust their portfolios accordingly - for at least the next six months.
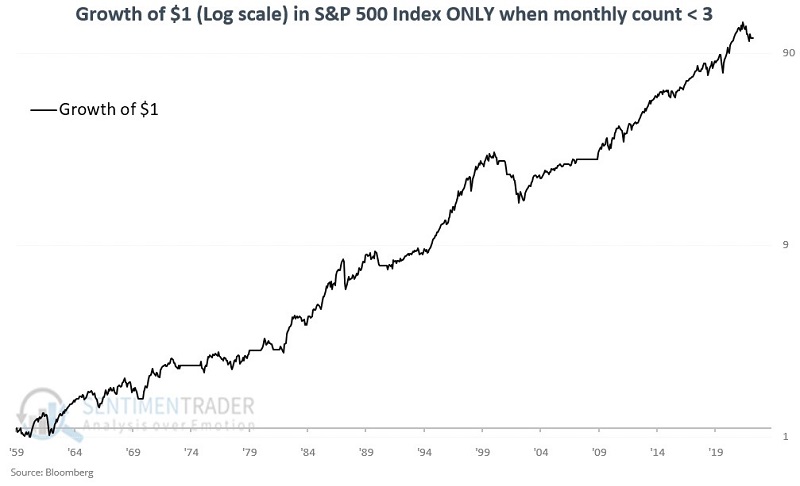
The chart below displays the cumulative growth of $1 invested in the S&P 500 Index ONLY when our count above is less than 3 (i.e., favorable). From 1959-08-31 through 2022-10-31, the cumulative gain was +10,760%
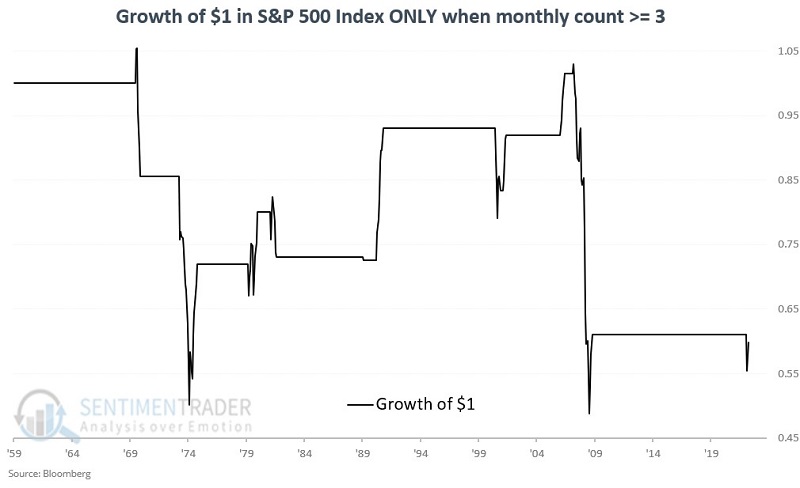
The chart below displays the cumulative growth of $1 invested in the S&P 500 Index ONLY when our count above is three or higher (i.e., unfavorable). From 1959-08-31 through 2022-10-31, the cumulative decline was -40%.
A declining trend in the Leading Economic Indicators does not preclude higher stock prices. But as you can see in the charts above, the odds of a market advance are greater when the indicators are trending higher.
Economic performance after a triple-double warning
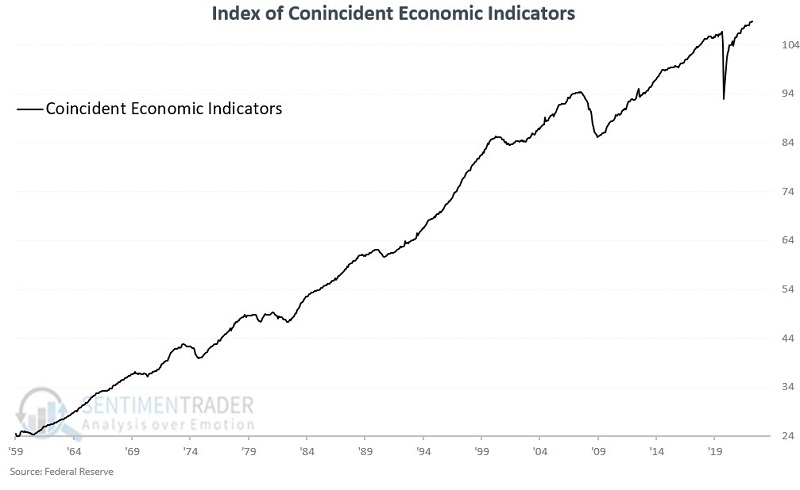
Now, instead of looking at S&P 500 performance, let's look at the performance of the Index of Coincident Economic Indicators. This index appears in the chart below.
The table below summarizes coincident indicator performance depending on whether the monthly count in our earlier chart is favorable or unfavorable.
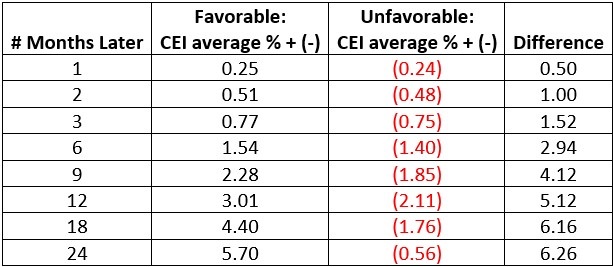
Note that economic activity declined on average over all time frames up to two years. Over a twelve-month period, the average decline in economic activity was in excess of -2%. A monthly count of 3 or more for the LEI indicators is an ominous sign for the overall economy.
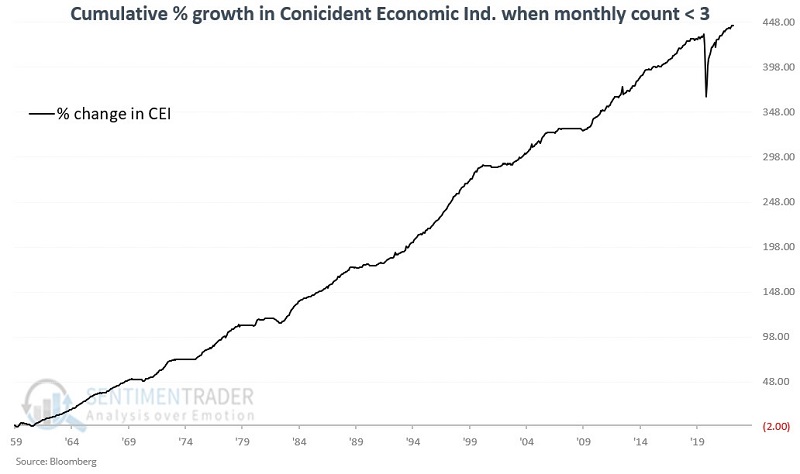
The chart below displays the cumulative percentage change in the Coincident Economic Indicators ONLY when our count above is less than 3 (i.e., favorable). From 1959-08-31 through 2022-10-31, the cumulative gain was +444%
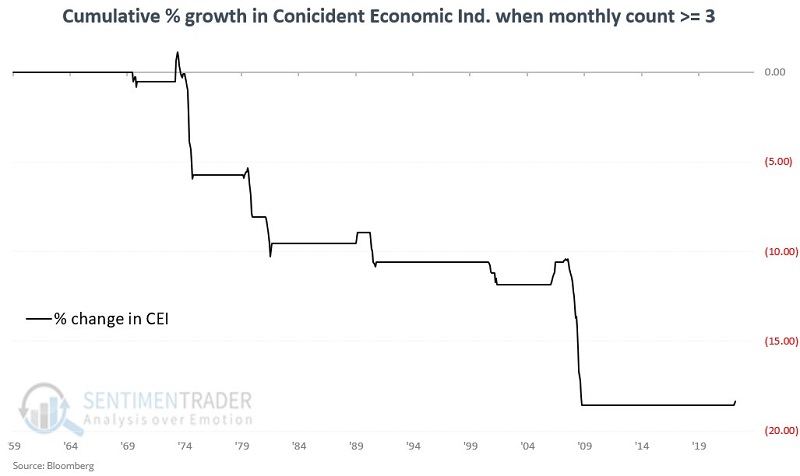
The chart below displays the cumulative percentage change in the Coincident Economic Indicators ONLY when our count above is three or higher (i.e., unfavorable). From 1959-08-31 through 2022-10-31, the cumulative decline was -18%, and warned of severe recessions in 1973-74, 1979-1981, 2001, and 2007-2009.
What the research tells us…
The results above suggest that the Conference Boards' Index of Leading Economic Indicators helps to accurately assess the future prospects for both stocks and the overall economy. The methods detailed above involve a bit of smoothing and patience before acting on the index trend rather than trying to interpret every up-and-down squiggle in the data. When both monthly LEI readings and the 6-month moving average trend lower for three consecutive months or more, it is almost invariably a critical warning sign for investors to reduce their expectations.