Products
SentimenTrader Trading Tools
‍
Backtest Engine
My Trading Toolkit
Correlation Analysis
Seasonality
Indicators & Data API
‍
Proprietary Indicators & Charts
Market Data API
Strategies & Scanner
‍
50+ Trading Strategies
Smart Stock Scanner
Research Reports
‍
Research Solutions
Reports Library
Free Resources
Simple Backtest Calculator
Simple Seasonality Calculator
The Kelly Criterion Calculator
Sentiment Geo Map
Public Research Reports
Pricing
Company
About
In the News
Testimonials
Client Success Stories
Contact
Log inLoginSign up
< BACK TO ALL REPORTS

Leading indicators are rolling over

Dean Christians
2022-09-23
The Conference Board's Leading Economic Index declined annually for the first time since 2020. A member of the Composite Recession Model that monitors this broad measure of leading indicators triggered a new warning signal. After similar alerts, stocks struggled, especially on a long-term basis.

Key points:

  • The Leading Economic Index is now contracting on an annual basis
  • At the same time, the long-term trend for the S&P 500 is bearish
  • After similar conditions, the S&P 500 was negative on a medium to long-term basis
  • The odds of a recession look more likely with the new LEI signal 

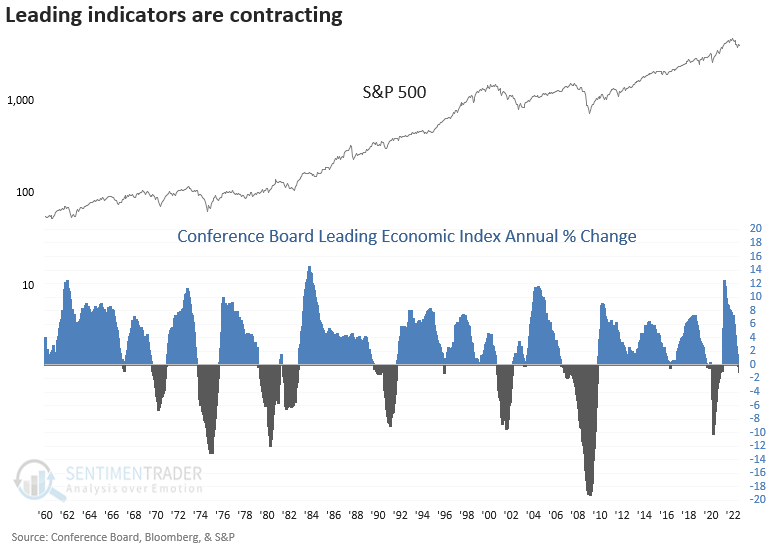
The Leading Economic Index measures a diverse group of leading indicators

The Conference Board released the August Leading Economic Index (LEI) on Thursday. The composite, which contains ten economic components, registered the first annual decline since the Covid recession. 

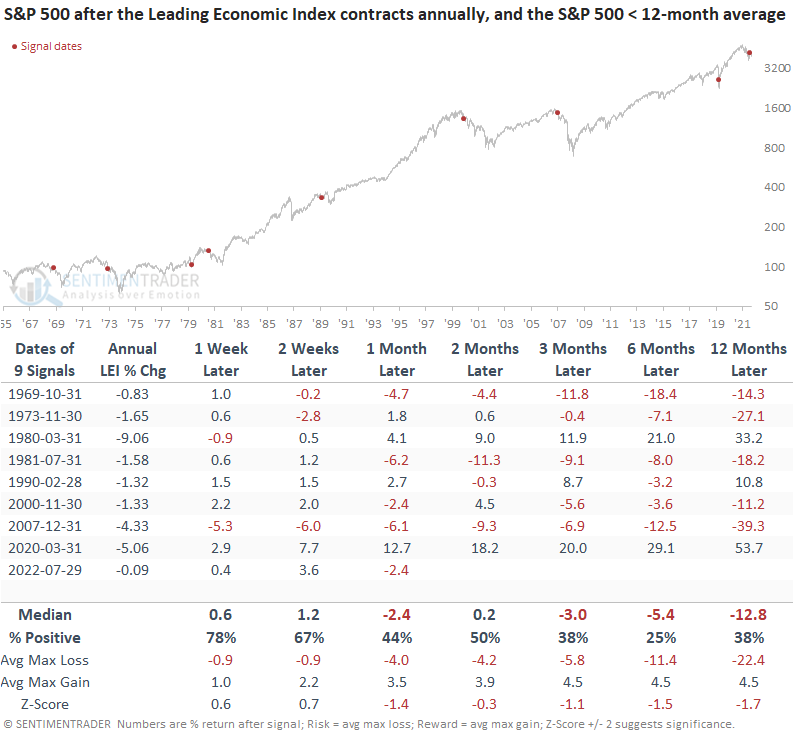
The contraction triggered a new alert for a member in the TCTM Composite Recession Model. When the LEI contracts annually and the S&P 500 is trading below its 12-month average, the environment for stocks is unfavorable.

Economic data operates with a lag and is subject to revisions. So, it's not an ideal timing mechanism for the stock market. However, it can give investors a general sense of the overall investing environment.

A contraction in leading indicators preceded negative returns for stocks

While the sample size is small, which is the case with most economic data, stocks struggled on a medium to long-term basis, especially 12 months later.

The original data for July did not show a contraction. In the August update, revisions caused the July annual number to turn negative, which is why the signal date occurred in July.

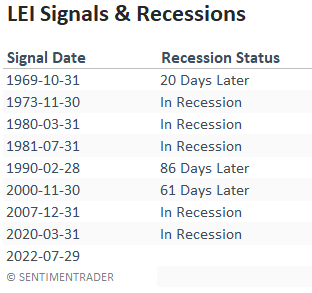
A recession looks more likely with the new LEI signal

Since 1969, the LEI model has generated an alert during a recession in five cases. If a signal occurred before a contraction in the economy, it took, on average, 55 days until the NBER declared a recession.

What the research tells us...

The Leading Economic Index, a broad measure of leading economic indicators, declined annually, with the S&P 500 trading below its 12-month average. Similar conditions preceded negative returns for the S&P 500, especially on a long-term basis. With the new signal, the weight of the evidence continues to build in favor of an economic contraction.

Sorry, you don't have access to this report

Upgrade your subscription plan to get access
Go to Dasboard
PRODUCTS
SentimenTrader
Trading Tools
Indicators & Data API
‍
Strategies & Scanner
‍
Research Reports
FREE
RESOUrCES
Simple Backtest
Calculator
Simple Seasonality
Calculator
The Kelly Criterion
Calculator
Sentiment Geo Map
‍
Public Research Reports
‍
Pricing
Bundle pricing
‍
Announcements
‍
FAQ
COMPANY
‍
About
‍
In the News
‍
Testimonials
‍
Client Success Stories
CONTACT
‍
General Inquiries
‍
Media Inquiries
‍
Financial Professionals Inquiries
‍
© 2025 Sundial Capital Research Inc. All rights reserved.
Setsail Marketing
TermsPrivacyAffiliate Program
Risk Disclosure: Futures and forex trading contains substantial risk and is not for every investor. An investor could potentially lose all or more than the initial investment. Risk capital is money that can be lost without jeopardizing ones’ financial security or life style. Only risk capital should be used for trading and only those with sufficient risk capital should consider trading. Past performance is not necessarily indicative of future results.

Hypothetical Performance Disclosure: Hypothetical performance results have many inherent limitations, some of which are described below. No representation is being made that any account will or is likely to achieve profits or losses similar to those shown; in fact, there are frequently sharp differences between hypothetical performance results and the actual results subsequently achieved by any particular trading program. One of the limitations of hypothetical performance results is that they are generally prepared with the benefit of hindsight. In addition, hypothetical trading does not involve financial risk, and no hypothetical trading record can completely account for the impact of financial risk of actual trading. for example, the ability to withstand losses or to adhere to a particular trading program in spite of trading losses are material points which can also adversely affect actual trading results. There are numerous other factors related to the markets in general or to the implementation of any specific trading program which cannot be fully accounted for in the preparation of hypothetical performance results and all which can adversely affect trading results.

Testimonial Disclosure: Testimonials appearing on this website may not be representative of other clients or customers and is not a guarantee of future performance or success.