
Korea's gains are good for tech, too

Key points:
- South Korea's KOSPI index has surged by a third in only 50 sessions
- A marked improvement in participation among stocks in the index has driven the jump
- Similar behavior has tended to precede further gains, and was a good sign for U.S. technology shares
A big jump in a relatively small market
Stocks have surged off April's generational bout of uncertainty. And some of the biggest beneficiaries aren't even domestic.
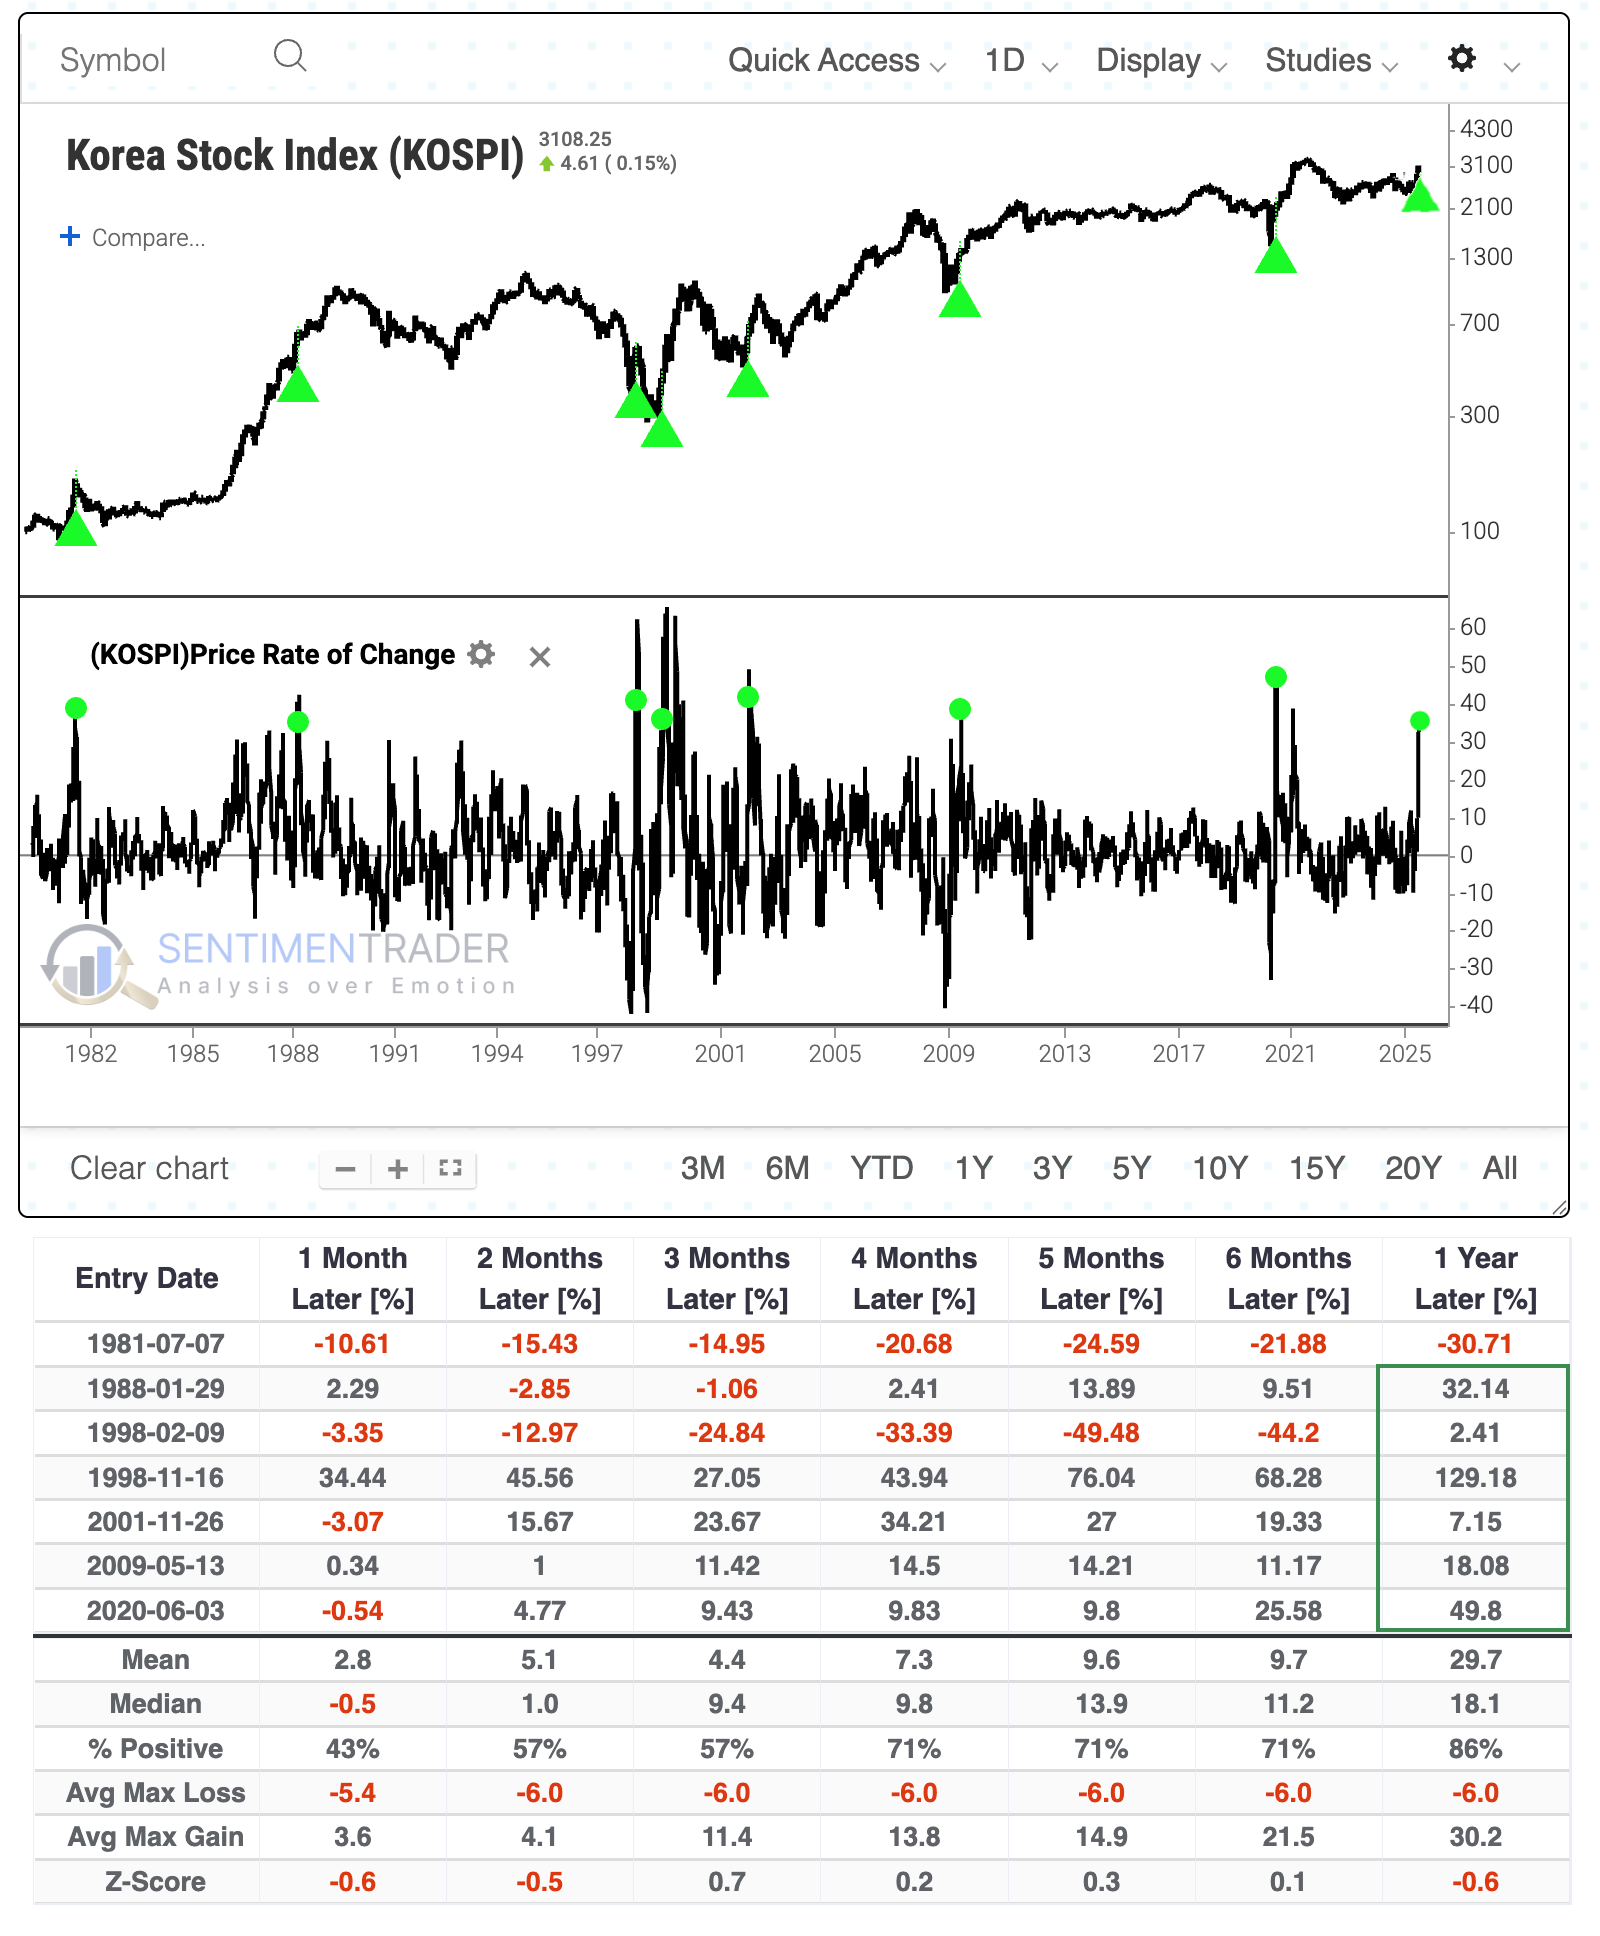
Some of the better-performing markets have been overseas - Asia specifically, and South Korea particularly. Over a 50-day span, the KOSPI jumped by more than a third for one of the few times in four decades, coming on the heels of what had been a -10% decline over 50 sessions.
The last four times the market rallied so hard coincided with major bottoming action. Prior to that, two instances proved to be false dawns, so its record is not perfect.
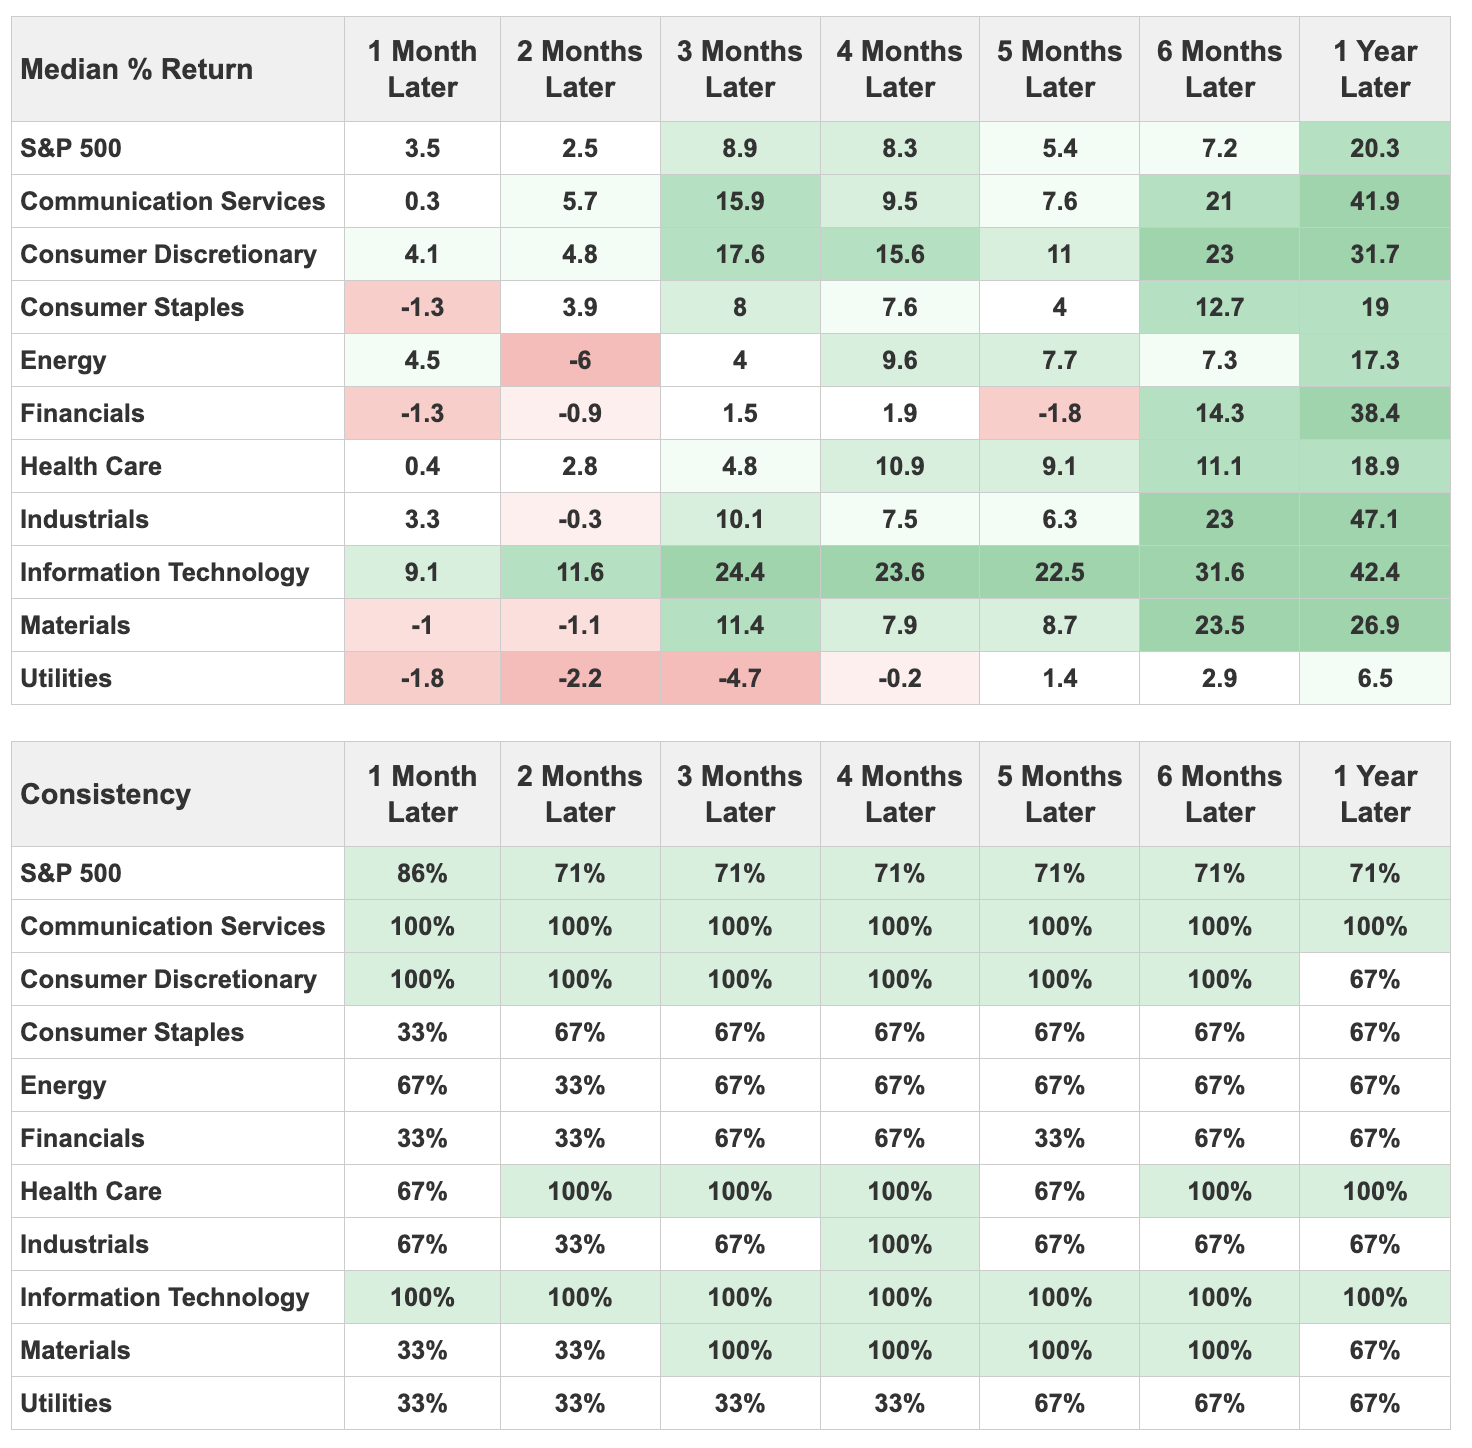
Korea is closely tied to U.S. technology companies, so these surges in the KOSPI were also good for U.S. sectors. As the table below shows, no sector stood out more than technology, with a 100% win rate across time frames, and exceptional returns in the months ahead. The S&P 500 averaged a one-year return greater than +20%.
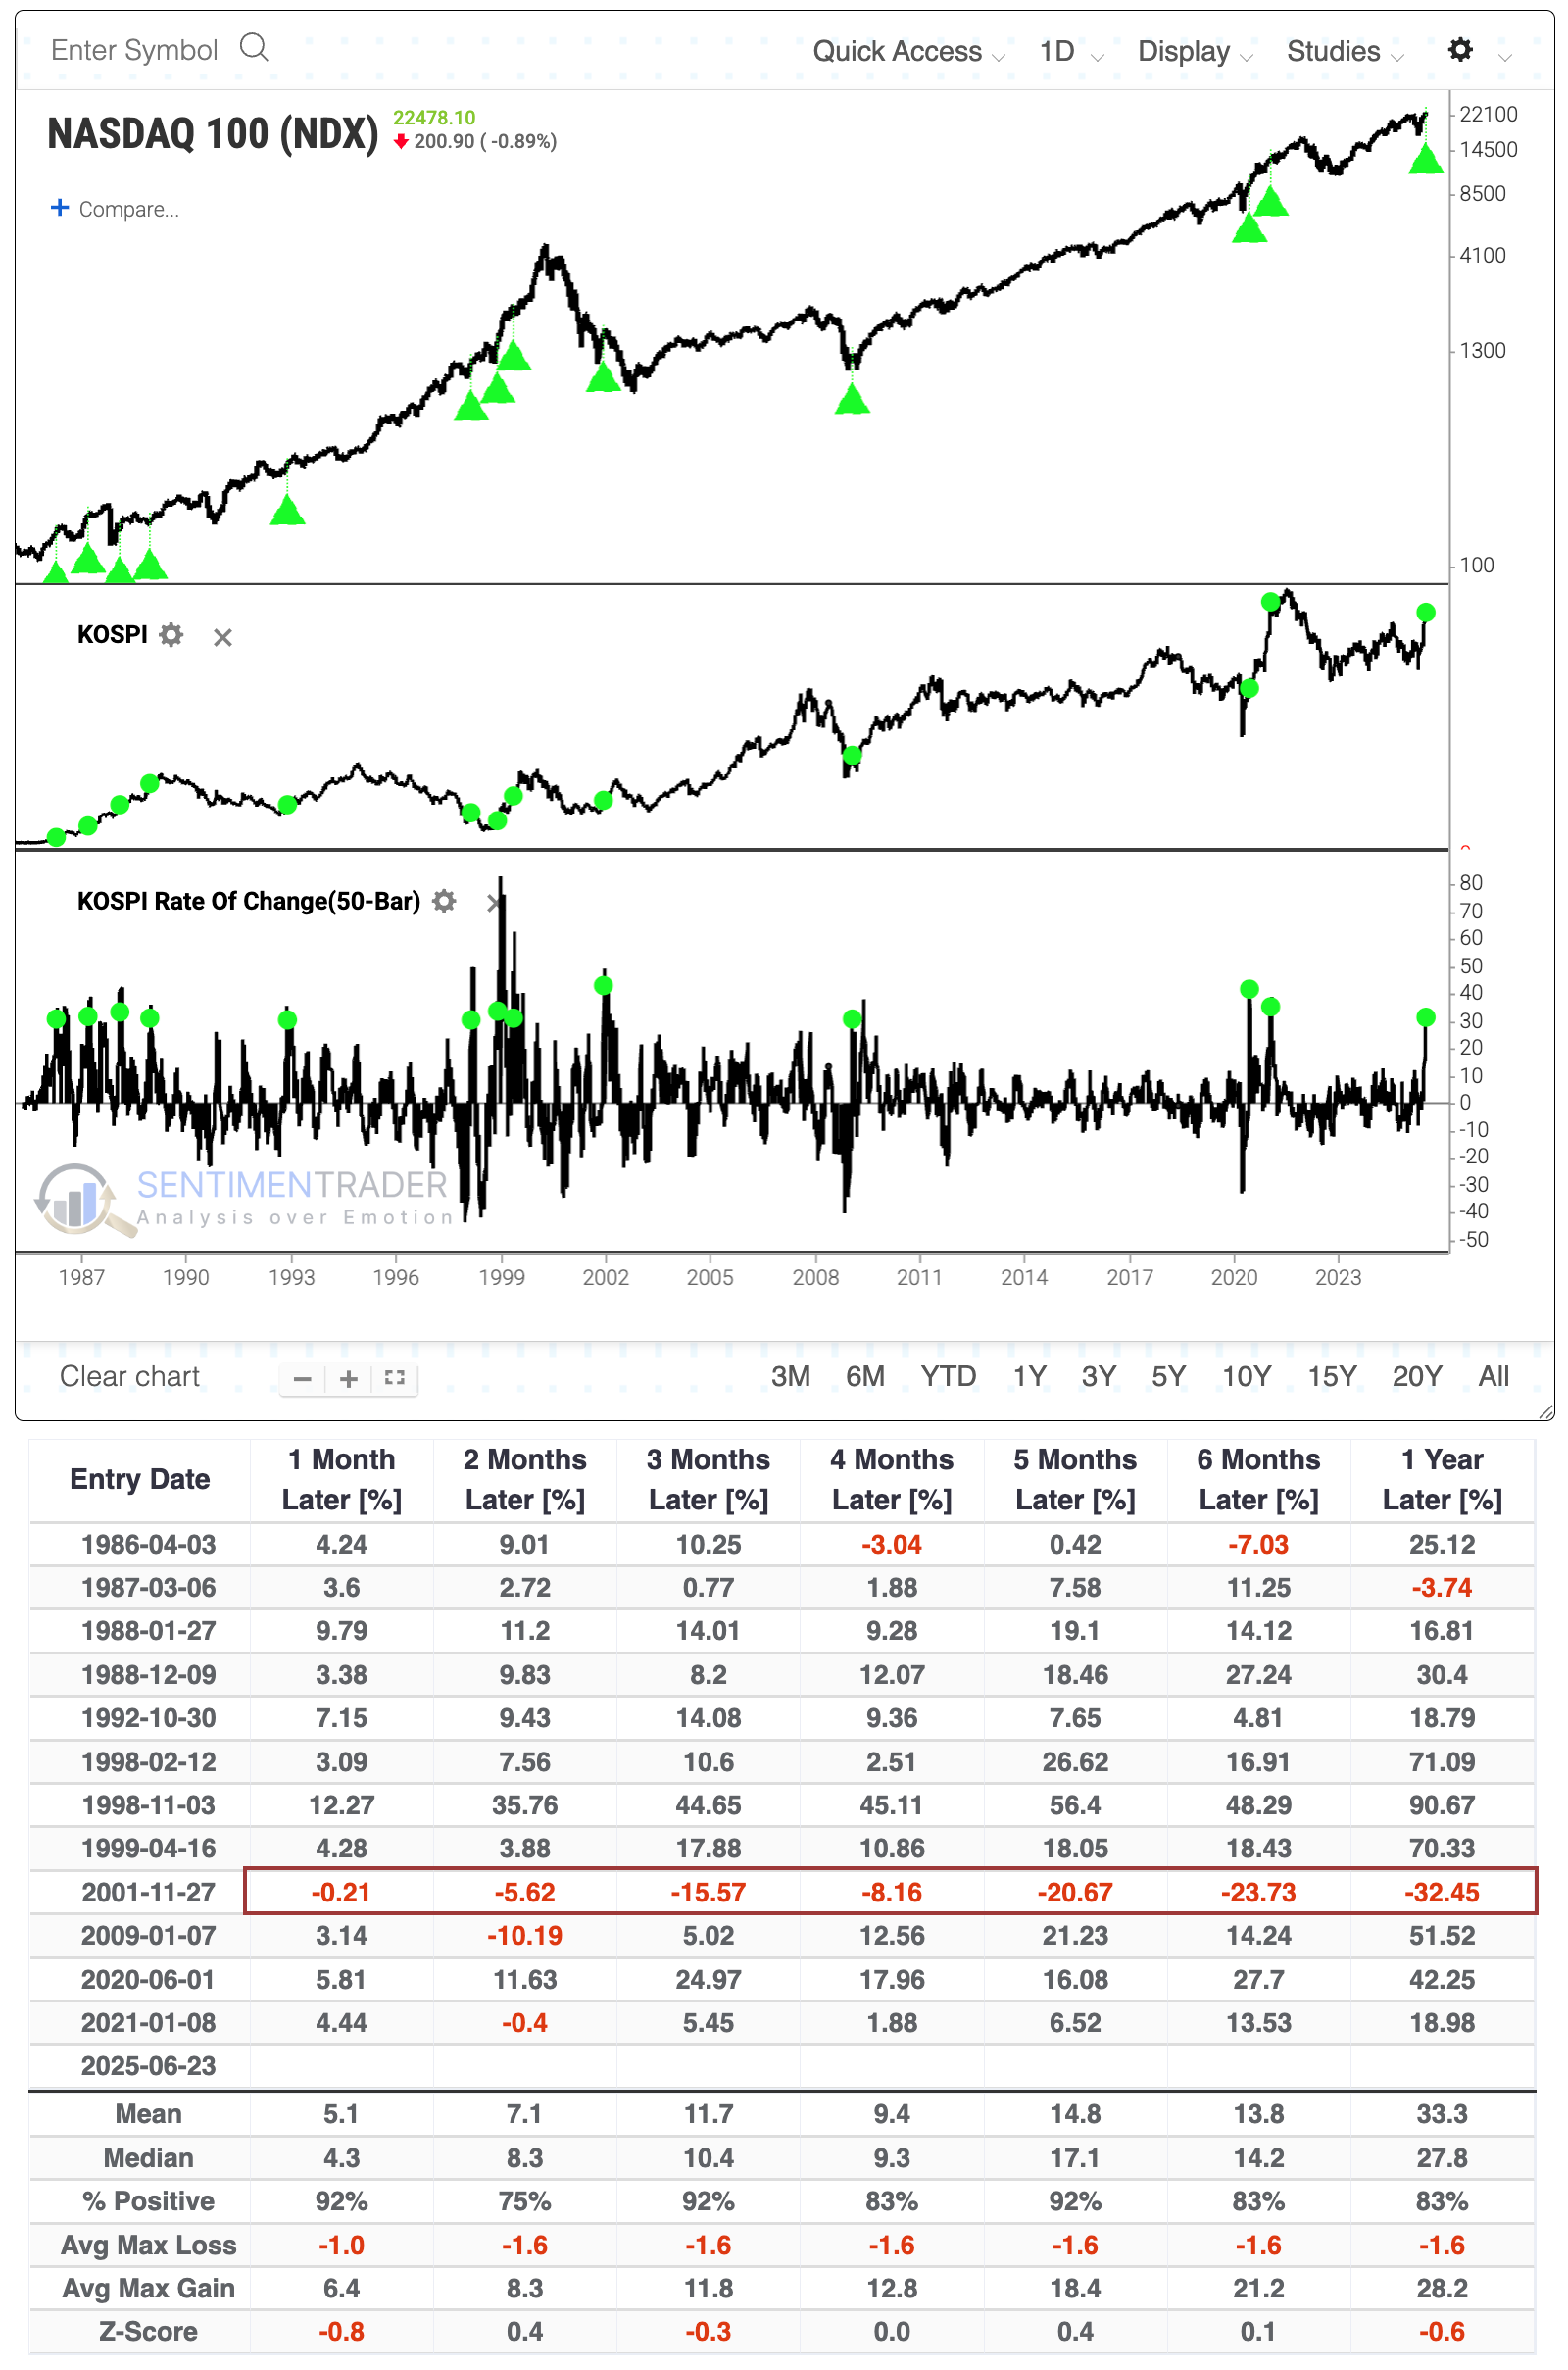
Taking a slightly different tack to generate a larger sample size, the chart and table below show returns in the Nasdaq 100 when the KOSPI's 50-day rate of change cycled from below zero to above +30%. We can clearly see how positive these surges were for U.S. tech, as the Nasdaq 100 suffered only a single outright failure. Within the following six months, the NDX suffered a -10% drawdown only twice, while enjoying more than +10% upside after 11 of 13 signals.
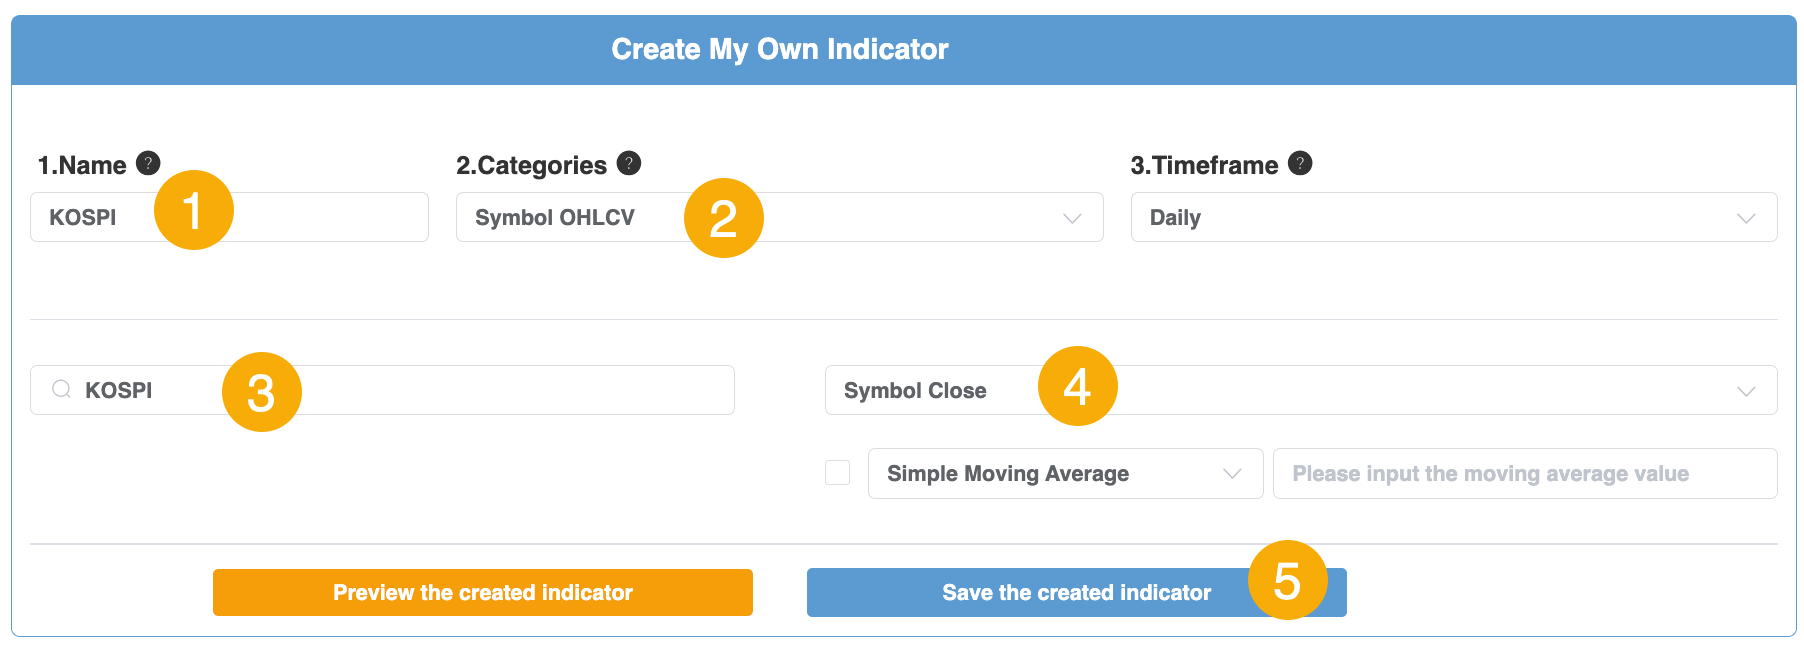
To recreate this test, first create a new indicator by going to My Stuff > My Indicator and clicking Create New Indicator (or click here).
Once loaded:
- Enter a name such as KOSPI
- Choose Symbol OHLCV
- Start typing Kospi in the drop-down menu and click it when it comes up
- Choose Symbol Close
- Click the button to save your new indicator
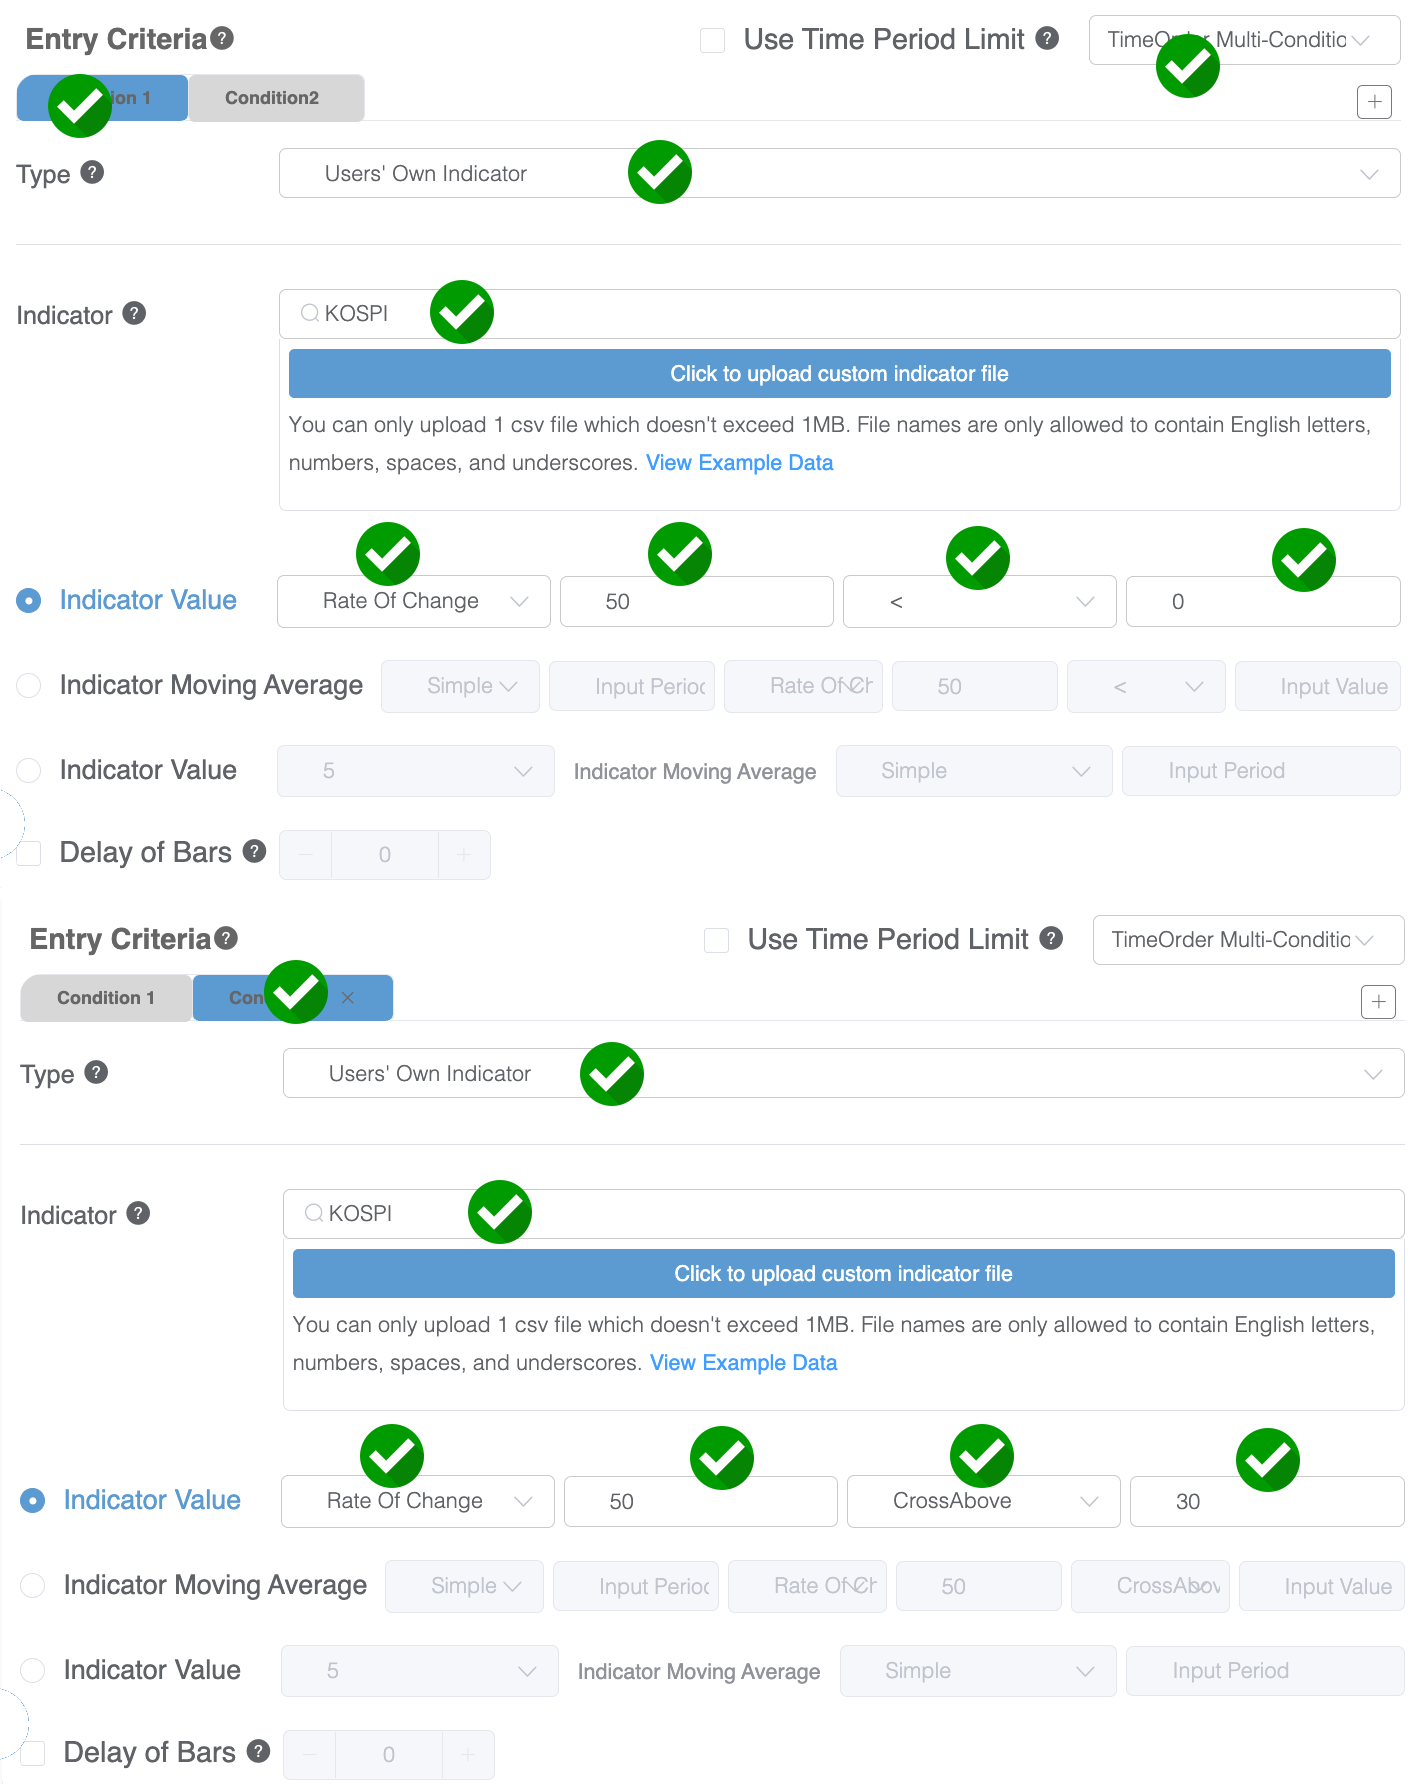
Once created, you can click here to load the test using the Nasdaq 100. If choosing to create the backtest yourself, choose NDX for your symbol and under Entry Criteria, use the TimeOrder Multi-Condition function to test the Nasdaq 100 against the KOSPI's 50-day rate of change as shown below. The checkmarks highlight fields you'd want to adjust to perform the test.
Improved participation
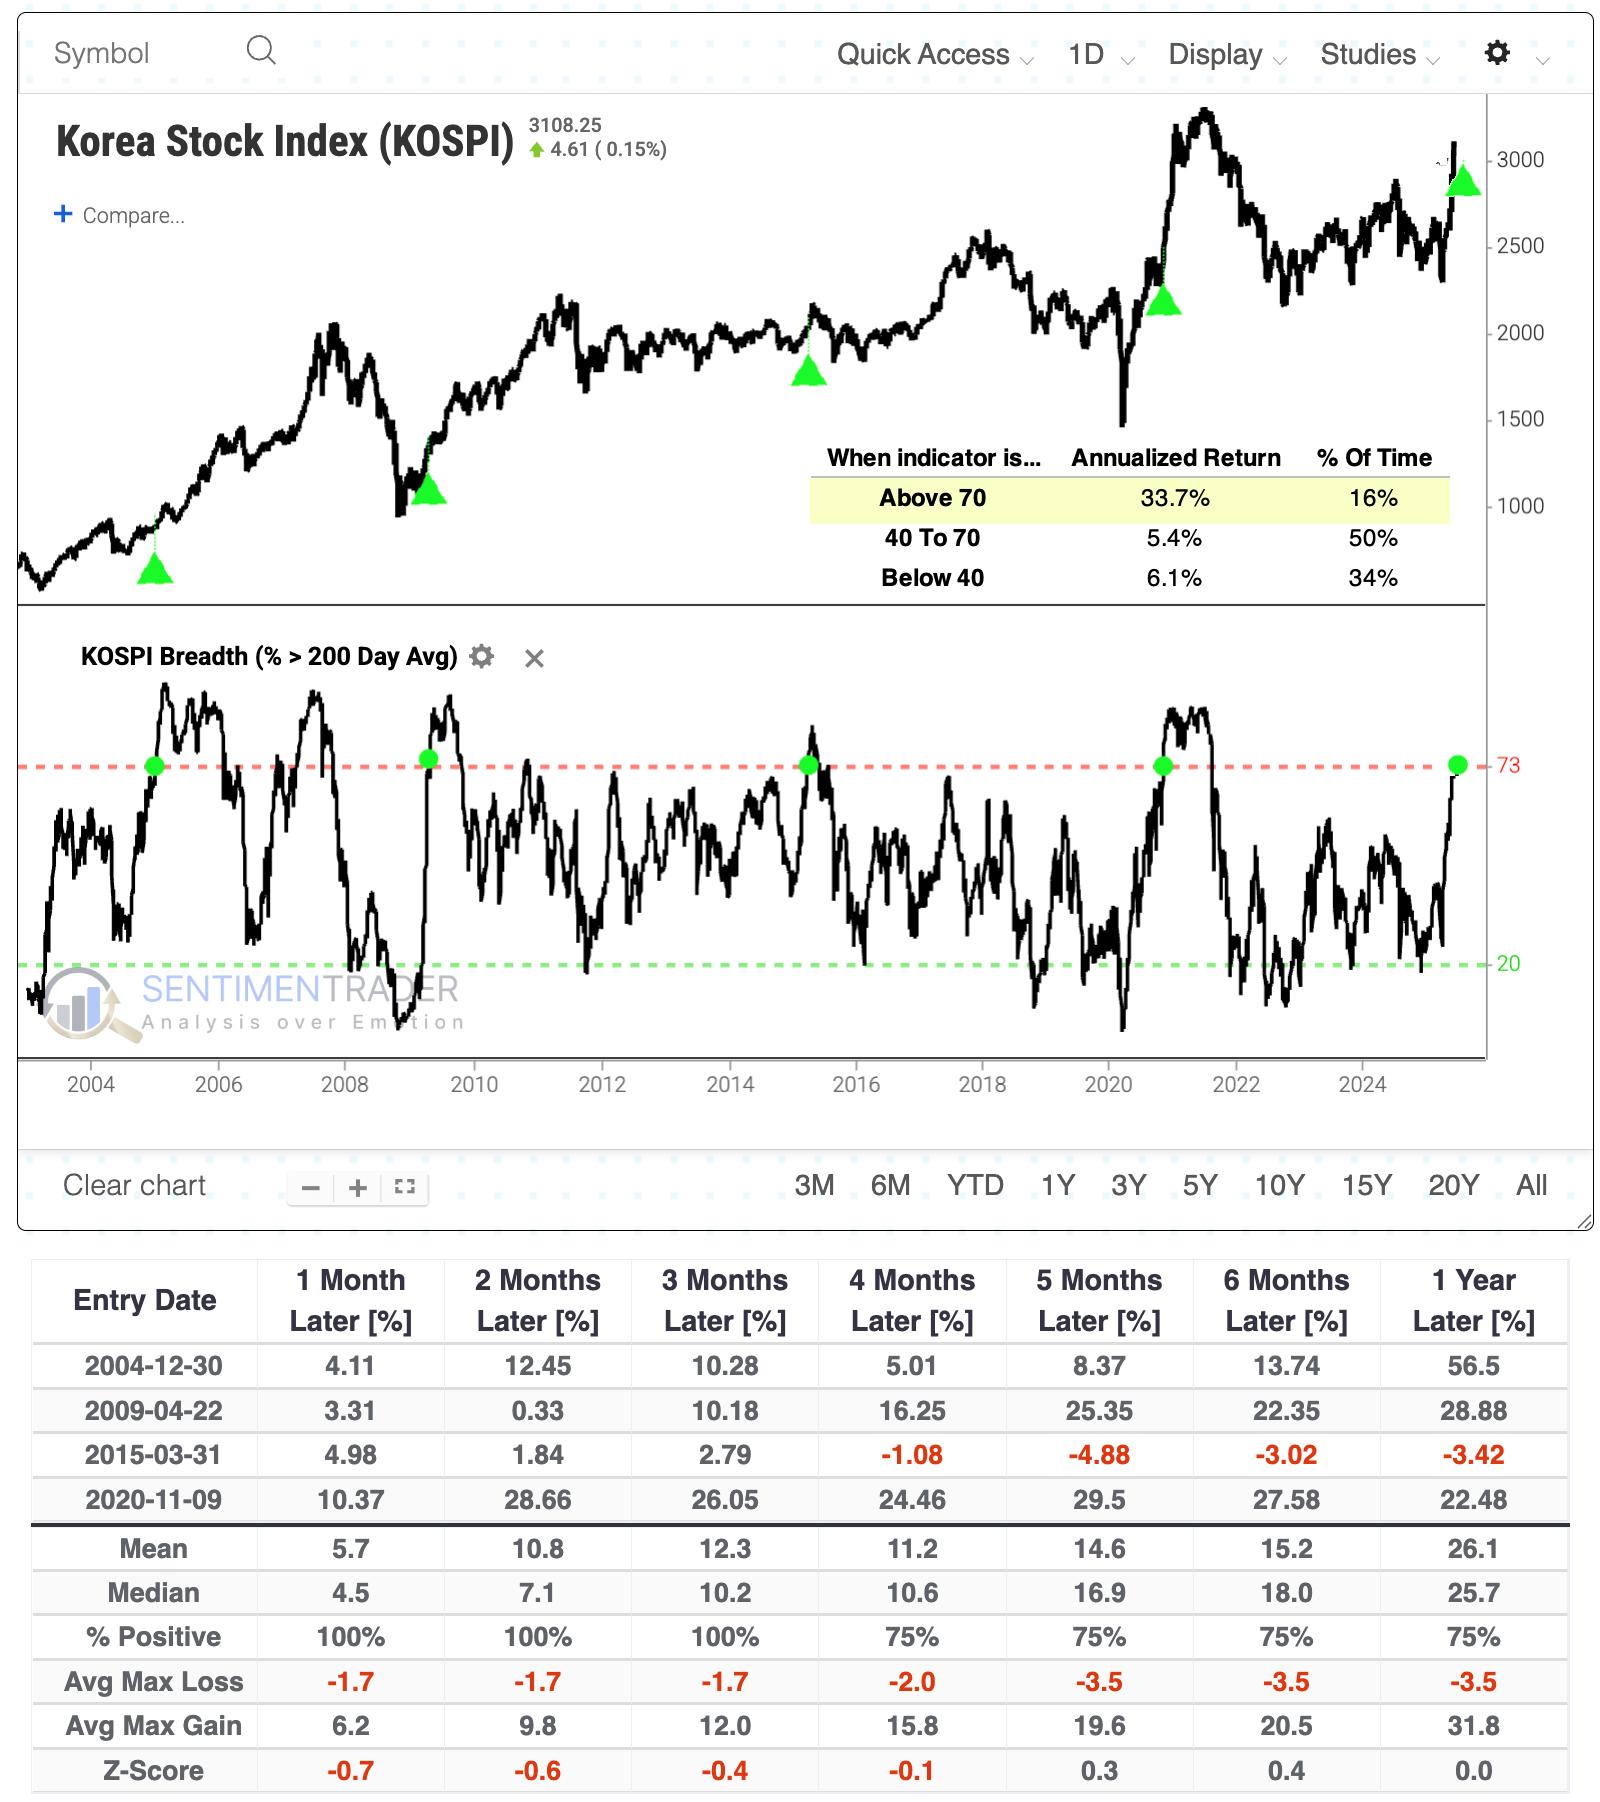
The index's jump has been driven by more stocks above their 200-day moving average. The chart below notes that the Kospi's annualized return was an impressive +33.7% when at least 70% of its stocks were trading above their 200-day moving average.
More than 73% of stocks in the index have recovered their long-term moving average, from what had been fewer than 20% of them doing so. Again, we have a miniscule sample size, but other cycles over the past 20+ years have delivered mostly positive returns. The biggest caveat was 2015, which saw the Kospi form a peak within the next three months.
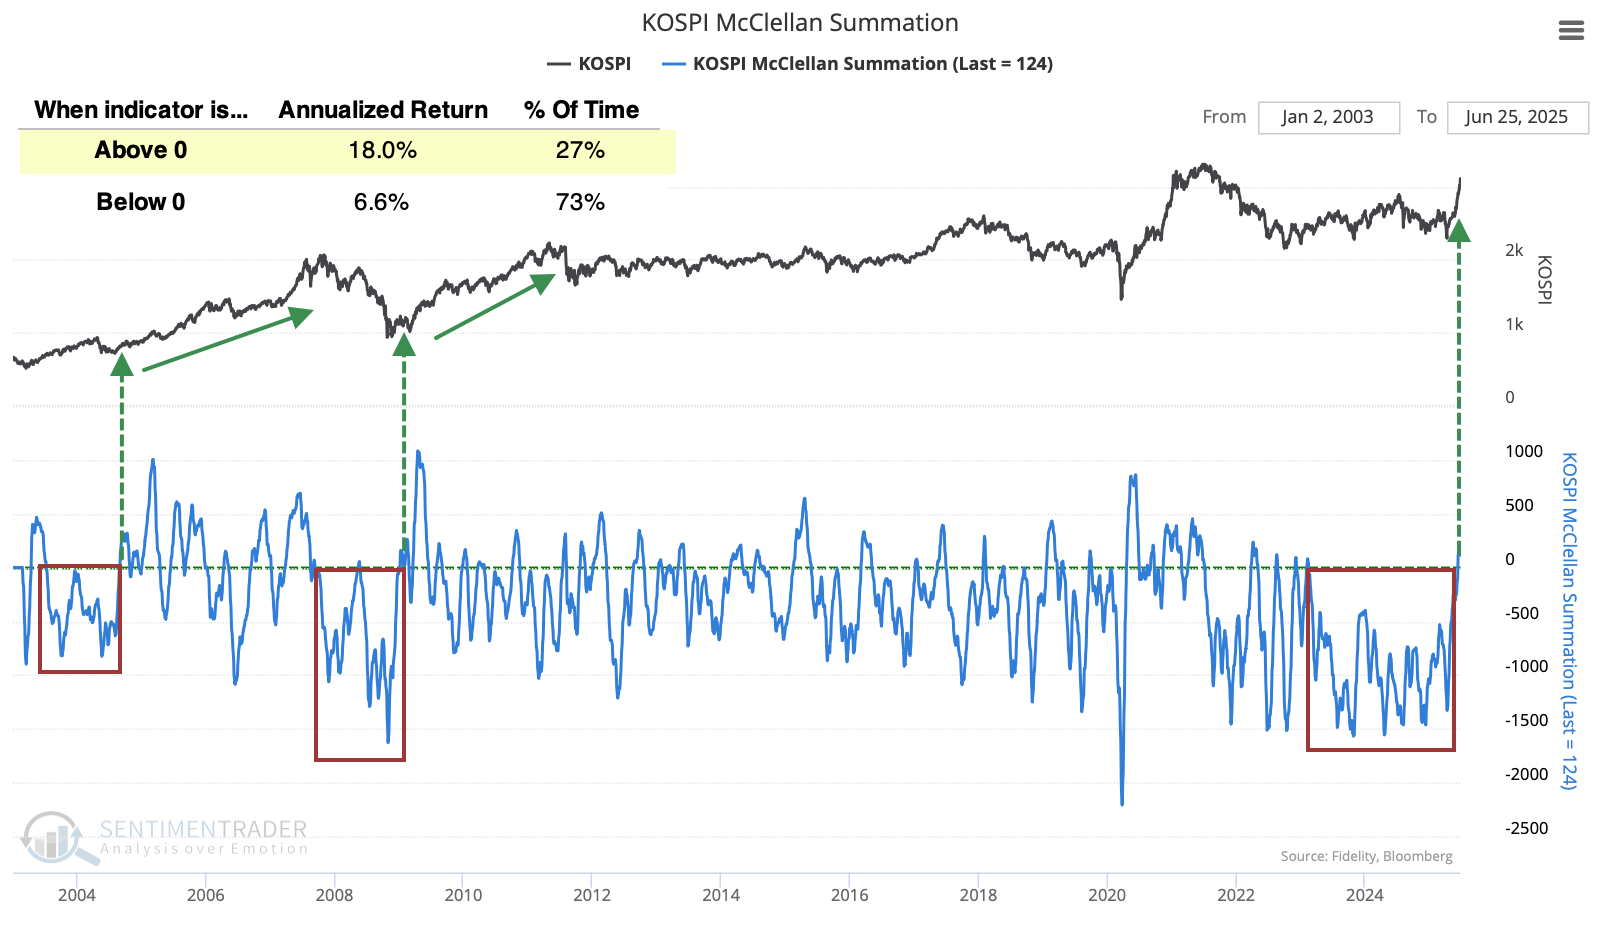
The sustained internal recovery in so many KOSPI stocks pushed its McClellan Summation Index above zero after its longest-ever stretch of being subdued in negative territory. Its annualized return when above zero was +18.0% compared to +6.6% when below zero. The only two similar situations, when the Summation Index jumped into positive territory after a sustained period below zero (or mostly so), preceded exceptional multi-year bull markets.
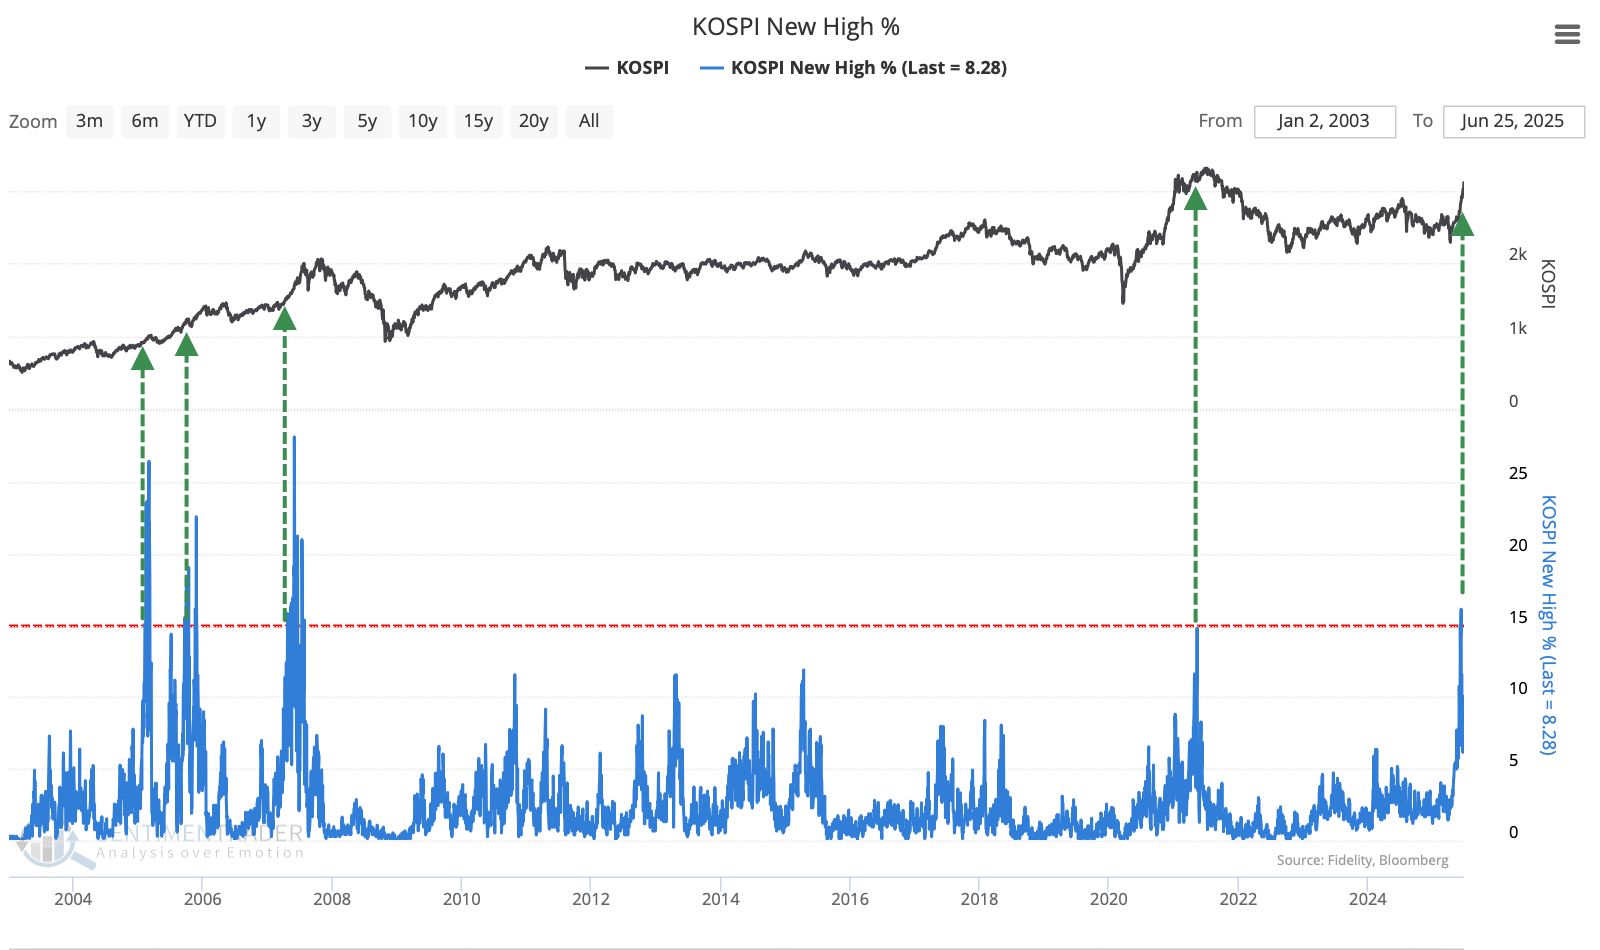
There was also a notable jump in 52-week new highs among the stocks. That index has very rarely seen so much participation at new highs, and the last time was not an auspicious one to jump on the bandwagon, as it triggered near the peak of the 2021 bull market. The other instances occurred during the sustained run in the mid-2000s and preceded further upside.
What the research tells us...
As Dean noted in June, Korean stocks have been doing very well, and shorter measures of strength have led to marked improvement in longer-term indicators of momentum and participation.
Such impressive displays have not been perfect markers of new and sustained bull markets, but just about. There have been a few failures of these stocks to hold their gains after similar bouts, but those were the exceptions rather than the rule. By the time these stocks have rallied this much and this broadly, the KOSPI has a very good track record of building on those gains in the months ahead. For U.S. investors, this has been an even better sign for the tech sector, particularly the Nasdaq 100 index.