Data &
Technology
Research
Reports
Report Solutions
Reports Library
Actionable
Strategies
Free
Resources
Simple Backtest Calculator
Simple Seasonality Calculator
The Kelly Criterion Calculator
Sentiment Geo Map
Public Research Reports
Free Webinar
Pricing
Company
About
Meet Our Team
In the News
Testimonials
Client Success Stories
Contact
Log inLoginSign up
< BACK TO ALL REPORTS

Keeping an Eye on Platinum

Jason Goepfert
2021-08-02
Platinum is heading into a period of seasonal weakness.

It is no secret that markets tend to move in waves. A given market will trend higher for a while - with countertrend movements interspersed along the way - and at other times, the same market will trend lower for a while.

And often, as the primary trend is changing, there is a period of great doubt as bulls and bears struggle for control. There can be a volatile trading range during these periods - OR an incredible amount of calm with seemingly little going on in that particular market. 

But ultimately, the time for "deciding" comes. At that point, traders need to be most focused on the market and prepared mentally and financially to do what they must to latch onto and profit from the next major trend. 

A market that appears to fit this bill at the moment is platinum. So, Jay recently took a closer look under the hood.

Consider the monthly chart of platinum futures (using continuous spot-month data) that appears below.

Platinum monthly price chart

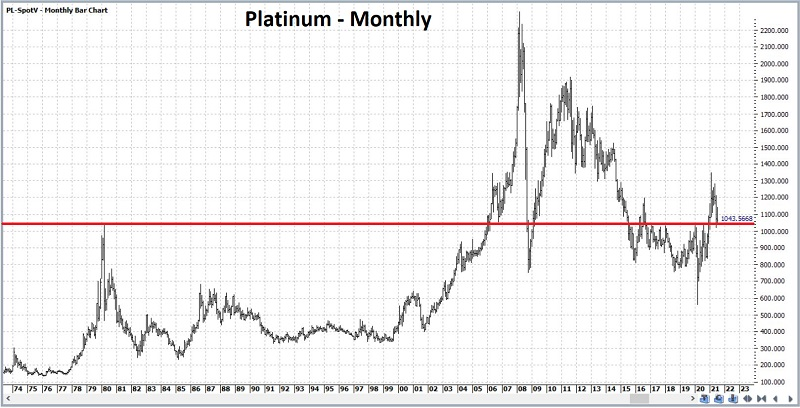
Platinum rallied sharply in the late 1970s before topping out near $1045 an ounce in early 1980. It then fell back and did not exceed $1045 again for another 26 years. After another 15 years of some big up and down swings, platinum is about where it stood in the early 1980s. Whether or not the price of platinum can hold against its long-term support/resistance price is an important piece of information.

The trend for platinum looks mixed depending on the time frame. That makes it harder to discern probabilities going forward, as the metal is entering a seasonally weak time of year.

Platinum seasonality

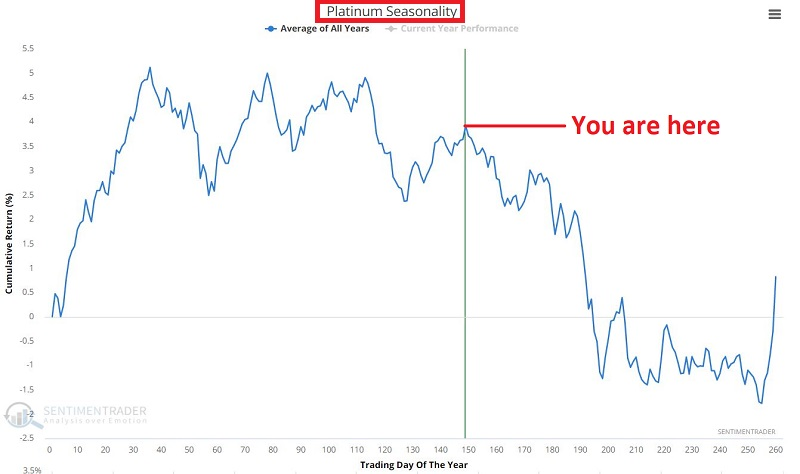
The win rate for platinum during the next 50 days has been 47%; however, the average loss has been almost twice as much as the average gain. In essence, when platinum is good (during this particular timeframe), it's "OK," but when it's bad, it's "awful."

Also, our Optimism Index for platinum recently crossed below 67%, showing high but declining confidence. During the past decade, similar signals preceded losses in platinum every time.


What else we're looking at

  • Returns in platinum following high but ebbing optimism
  • Smart money hedgers are heavily short orange juice

Stat box

The S&P 500 rose for its 6th consecutive month while closing at an all-time high. Of the other times the index has done this since 1928, it continued to rise over the next 3 months 13 out of 15 times.

Etcetera

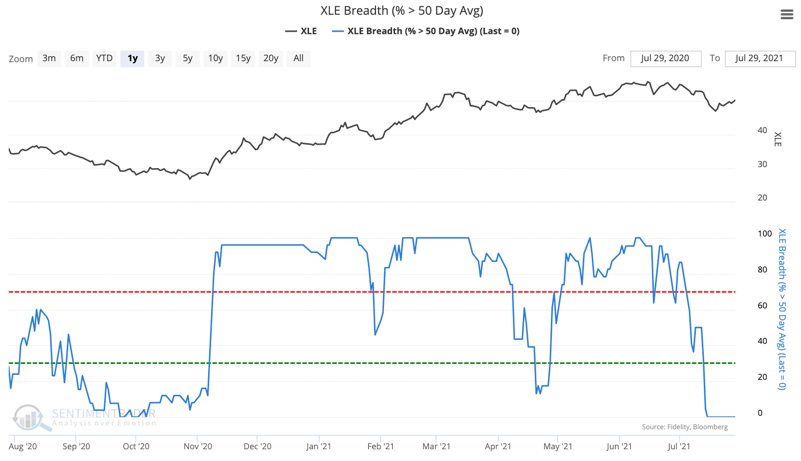
No energy. The percentage of XLE stocks trading above their 50-day average has dropped to zero for the first time since Aug. 2020 and been stuck there for over a week.

xle energy percent members above 50 day moving average

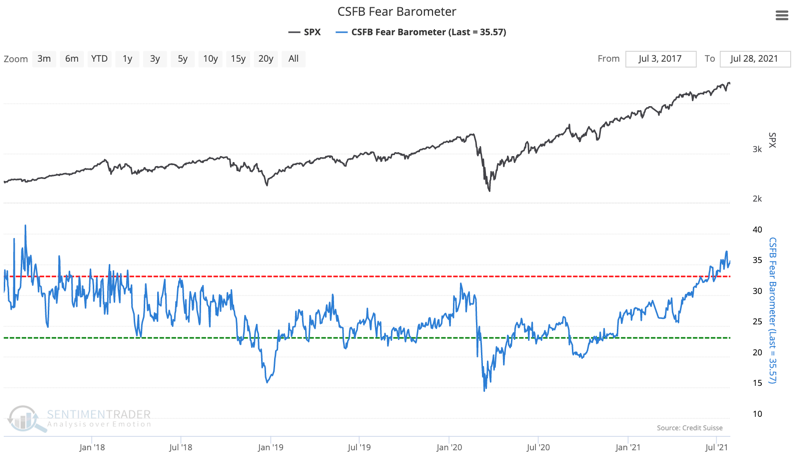
Skeptics. The CSFB Fear Barometer has reached its highest point since mid-2017, supposedly showing that traders are paying up for protection against a market decline.

csfb fear barometer

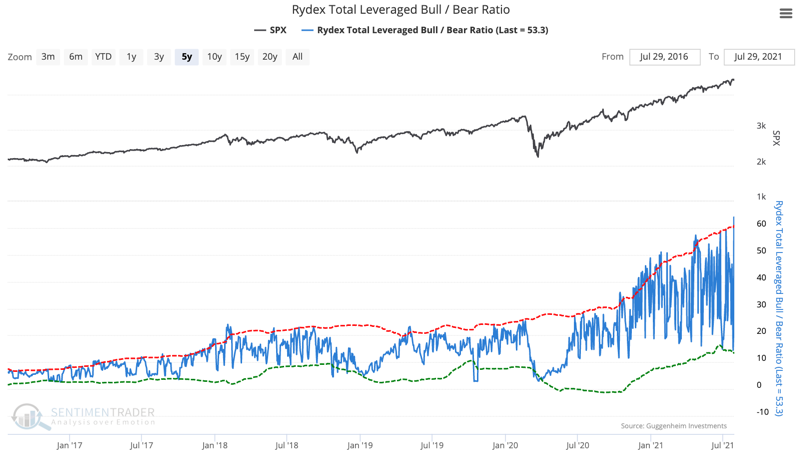
Go big or go bear. Non-options traders are betting heavily on higher prices. The Rydex Total Leveraged Bull / Bear Ratio has reached a new high, with 60 times more assets in leveraged bullish funds than bearish ones.

rydex leveraged bull bear ratio

DATA &
TECHnologies
IndicatorEdge
‍
BackTestEdge
‍
Other Tools
‍
DataEdge API
RESEARCH
reports
Research Solution
‍
Reports Library
‍
actionable
Strategies
Trading Strategies
‍
Smart Stock Scanner
‍
FREE
RESOUrCES
Simple Backtest
Calculator
Simple Seasonality
Calculator
The Kelly Criterion
Calculator
Sentiment Geo Map
‍
Public Research Reports
‍
Free Webinar
COMPANY
‍
About
‍
Meet our Team
‍
In the News
‍
Testimonials
‍
Client Success Stories
Pricing
Bundle pricing
‍
Announcements
‍
FAQ
© 2024 Sundial Capital Research Inc. All rights reserved.
Setsail Marketing
TermsPrivacyAffiliate Program
Risk Disclosure: Futures and forex trading contains substantial risk and is not for every investor. An investor could potentially lose all or more than the initial investment. Risk capital is money that can be lost without jeopardizing ones’ financial security or life style. Only risk capital should be used for trading and only those with sufficient risk capital should consider trading. Past performance is not necessarily indicative of future results.

Hypothetical Performance Disclosure: Hypothetical performance results have many inherent limitations, some of which are described below. No representation is being made that any account will or is likely to achieve profits or losses similar to those shown; in fact, there are frequently sharp differences between hypothetical performance results and the actual results subsequently achieved by any particular trading program. One of the limitations of hypothetical performance results is that they are generally prepared with the benefit of hindsight. In addition, hypothetical trading does not involve financial risk, and no hypothetical trading record can completely account for the impact of financial risk of actual trading. for example, the ability to withstand losses or to adhere to a particular trading program in spite of trading losses are material points which can also adversely affect actual trading results. There are numerous other factors related to the markets in general or to the implementation of any specific trading program which cannot be fully accounted for in the preparation of hypothetical performance results and all which can adversely affect trading results.

Testimonial Disclosure: Testimonials appearing on this website may not be representative of other clients or customers and is not a guarantee of future performance or success.