Keeping a Cautious Eye on Energy
Since achieving the status of "one of the most hated sectors of all-time," the energy sector has enjoyed an 80+% advance in just over 8 months. If history is a guide, energy may well outperform the broader market over the next several years.
That's the good news. The bad news is that the energy sector is entering a time of year that has seen it struggle mightily over the last 4 decades. Let's take a closer look.
SEASONALITY
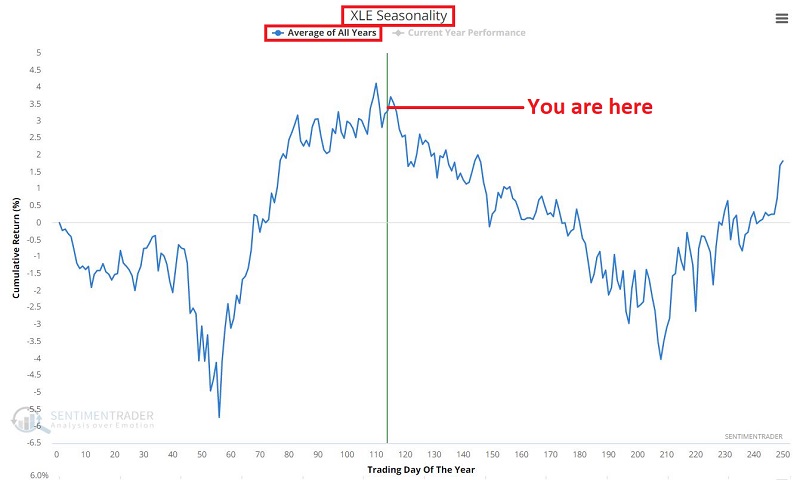
The chart below displays the annual seasonal trend for ticker XLE (Energy Select Sector SPDR Fund).

The message from this chart is NOT that energy stocks cannot continue to rally or that they are doomed to fall in the months ahead. The message is that they will have to overcome some serious seasonal headwinds for them to continue trending higher.
ENERGY - JULY THROUGH OCTOBER
Next, let's look at the S&P 500 Energy Sector performance during July through October every year starting in 1981. The chart below displays the cumulative % +(-) achieved by holding the energy sector long ONLY during July through October every year since 1981.
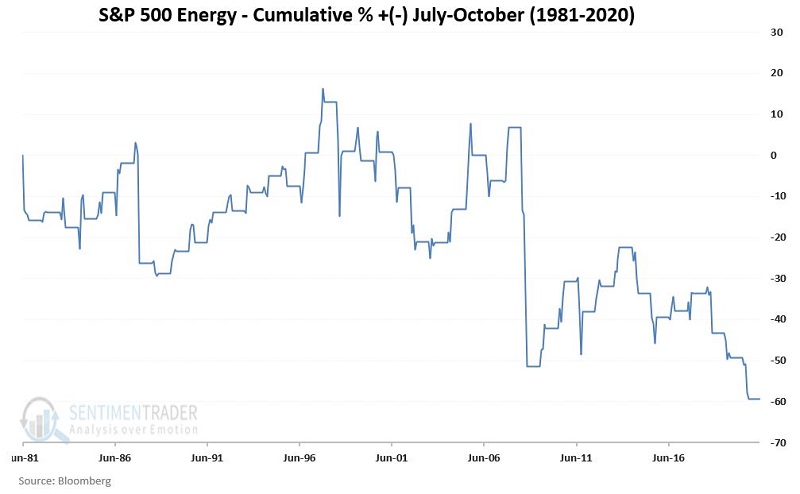
The bad news is fairly obvious. The sector has lost almost -60% on a cumulative basis during these "unfavorable" months. The good news is that it CAN and does rally within this period more often than it may seem. Note in the table below that this sector has actually shown a July-October gain more often than it has shown a loss.
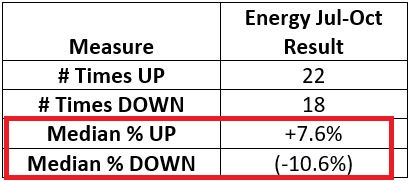
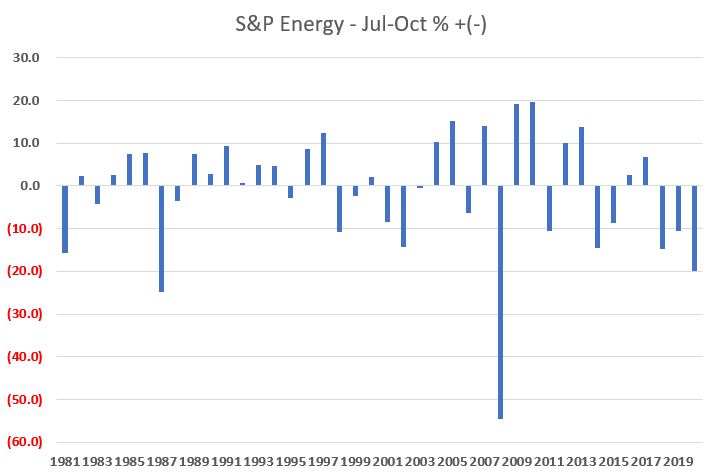
The problem is this: When it's good, it's OK, and when it's bad, it's very bad. This phenomenon is visible in the chart below that shows the yearly % + (-) for energy during July-October.
AN ADDITIONAL CONCERN: PRICE ACTION
As I have mentioned in the past, I am not a true "Elliott Head," but I pay attention to situations where the Elliott Wave count appears to corroborate other information. For this, I use the Elliott Wave algorithm built into ProfitSource.
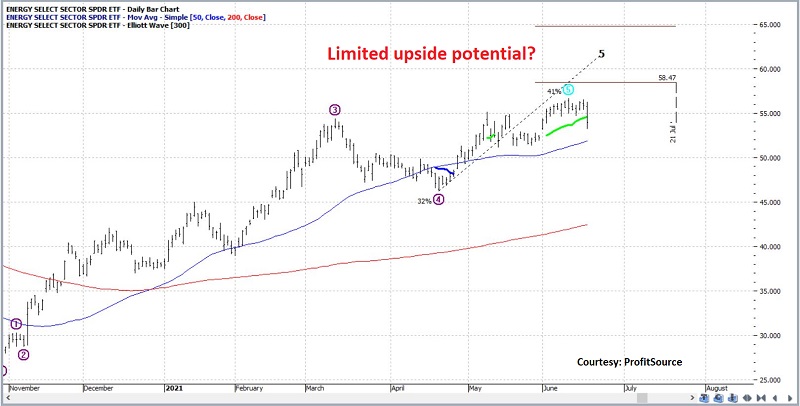
The chart below displays the daily Elliott Wave count for ticker XLE. The projection called for a Wave 5 rally toward $58.47 a share. XLE recently reached $56.65 before falling back. The implication of this chart is the suggestion that there may not be a great deal of upside potential left in the near term - even if XLE does break out to a nominal new high.
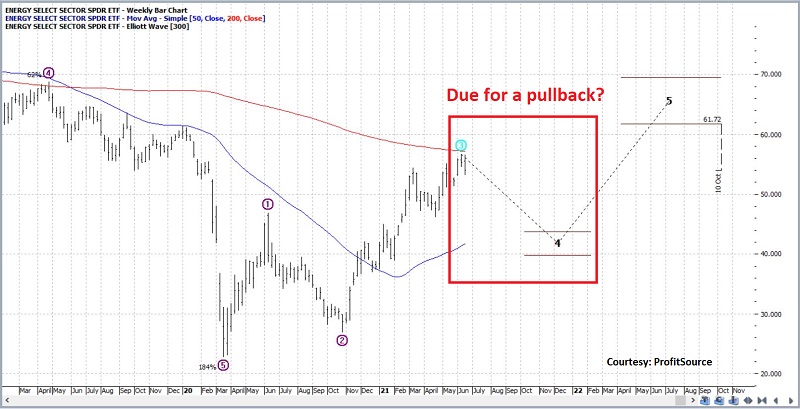
The chart below displays the weekly Elliott Wave count for ticker XLE. While the weekly count is in the midst of an apparent longer-term uptrend, in the near term, it is projecting a possible pullback in price (a Wave 4 decline) in the months ahead. This fits well with the seasonal pattern showed above.
SUMMARY
Is the energy sector doomed to fall in the months ahead? Not at all. As long as price remains in an uptrend (however, an individual trader might define that), there is nothing wrong with giving the sector the benefit of the doubt. But the gist of the information above is that seasonality and Elliott Wave suggests that the sector may struggle in the months ahead and that investors and traders who have enjoyed big gains may do well to adjust their expectations accordingly.


