
Keep an eye on this early cycle buy signal

Key points:
- According to the latest BofA fund manager survey, investors are the most overweight staples vs. discretionary since Jan 2009
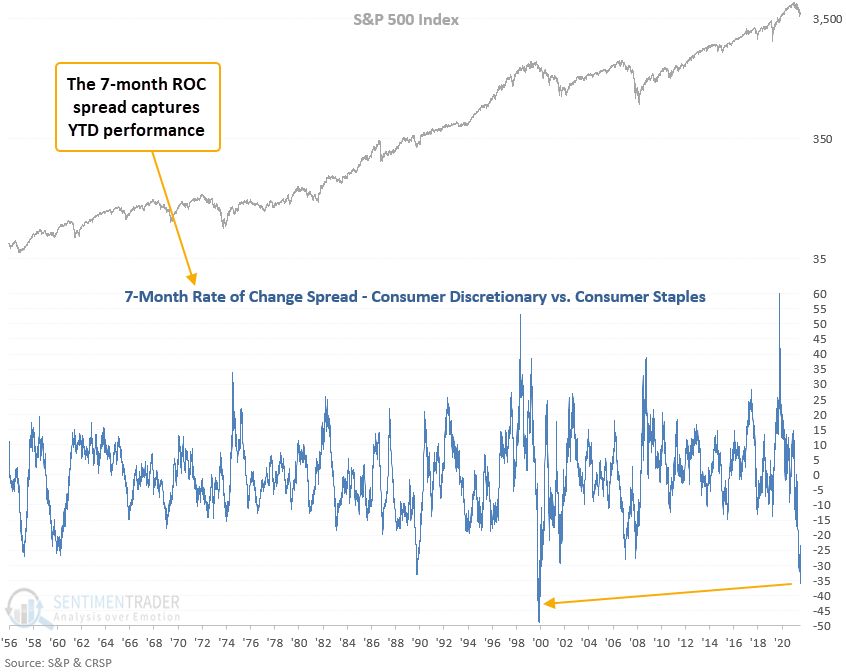
- A performance spread between discretionary and staples sectors has fallen to the lowest level since 2000
- One can use the relative ratio between the discretionary and staples sectors to identify a bullish early cycle buy signal
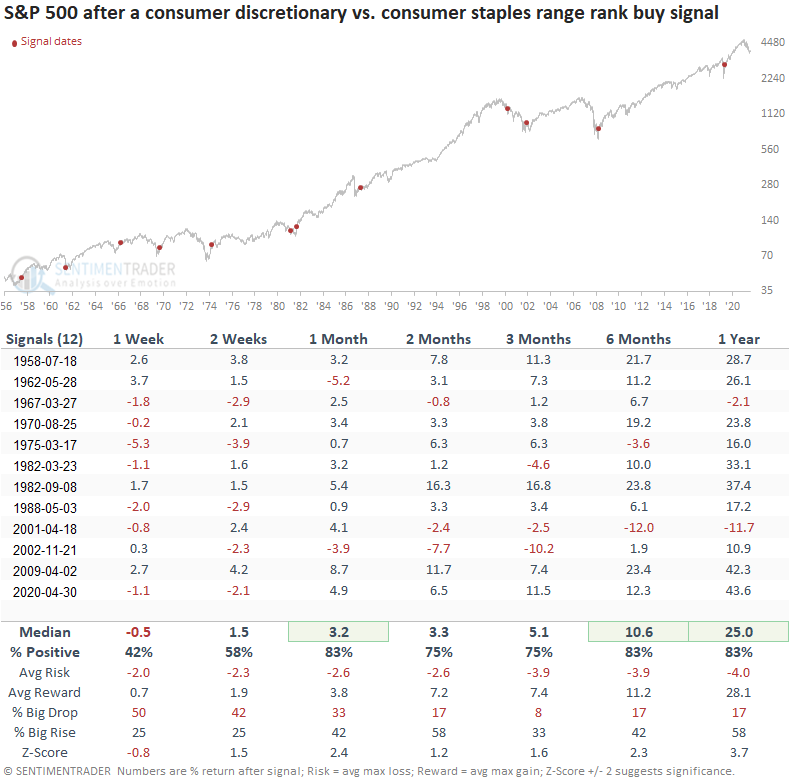
- Using history as a guide, the S&P 500 rallied 83% of the time over the next year after bear market signals
With the S&P 500 index mired in a bear market, let's assess the outlook for S&P 500 after the relative ratio between discretionary and staples sectors increases in favor of early cycle stocks. To be clear, I will eliminate instances that occurred within the context of a correction or when the index was at a high.
 A trading model that identifies a reversal in an early cycle ratio
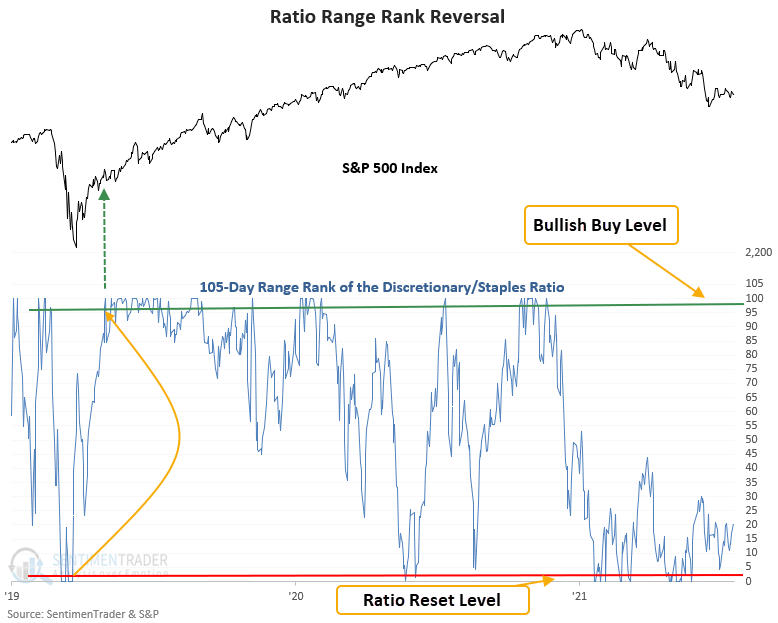
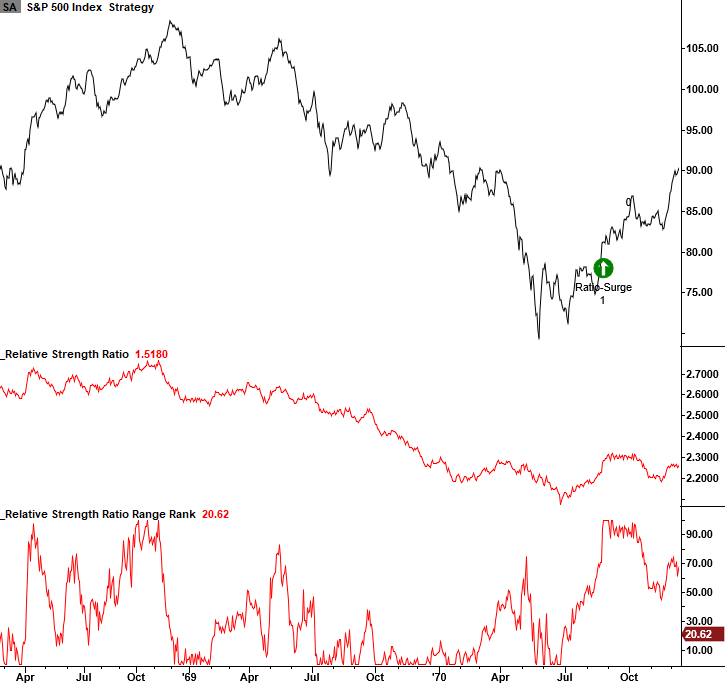
The model applies a 105-day range rank to the ratio between the consumer discretionary and the consumer staples sectors. As a reminder, the range rank indicator measures the current value relative to all other values over a lookback period. 100 is the highest, and 0 is the lowest. The ratio reset condition occurs when the range rank for the ratio crosses below the 1st percentile. A new buy signal triggers when the range rank exceeds the 99th percentile.
Signals associated with a bear market (down 20% or more from multi-year high)
This model generated a signal 12 times over the past 64 years. After the others, S&P 500 future returns, win rates, and z-scores were excellent across medium and long-term time frames. The signal shows a gain at some point in the first year in 11 out of 12 instances.
Let's zoom in and review some of the bear market signals/charts since 1968.
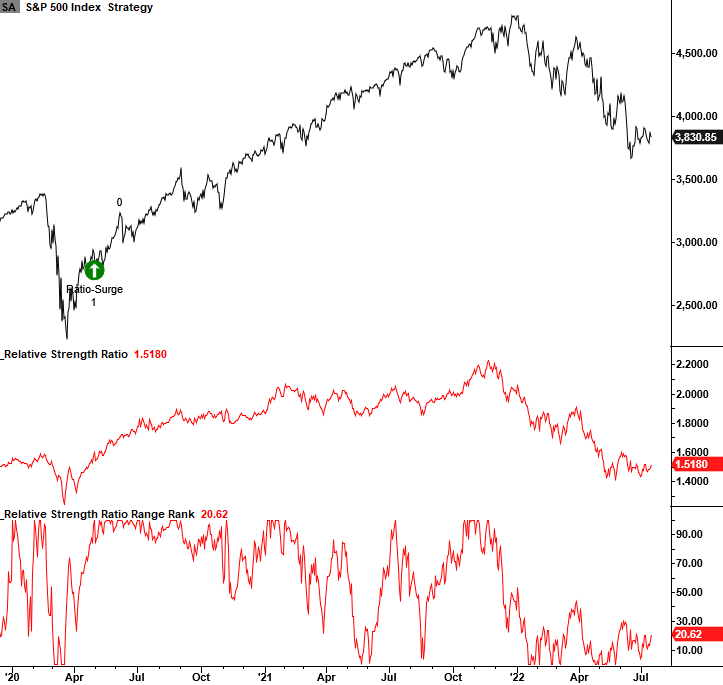
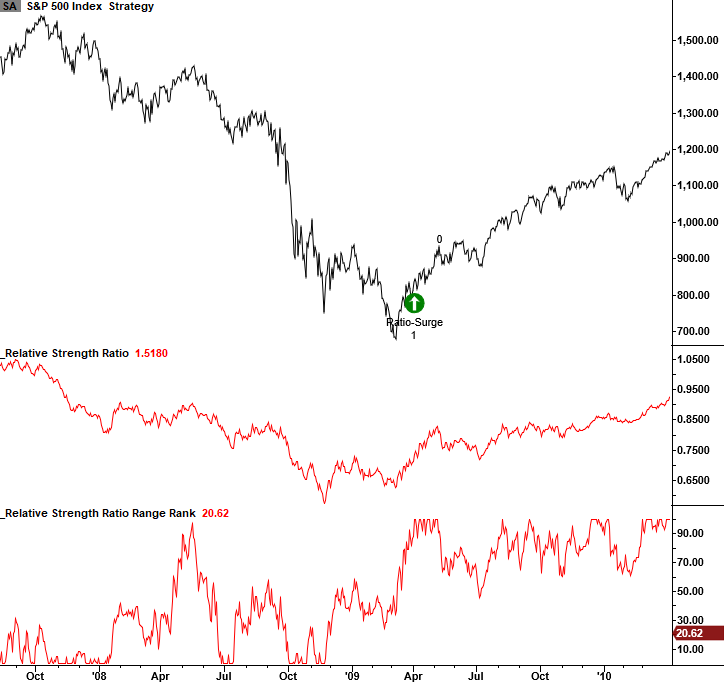
Current day chart example
2007-08 bear market chart example
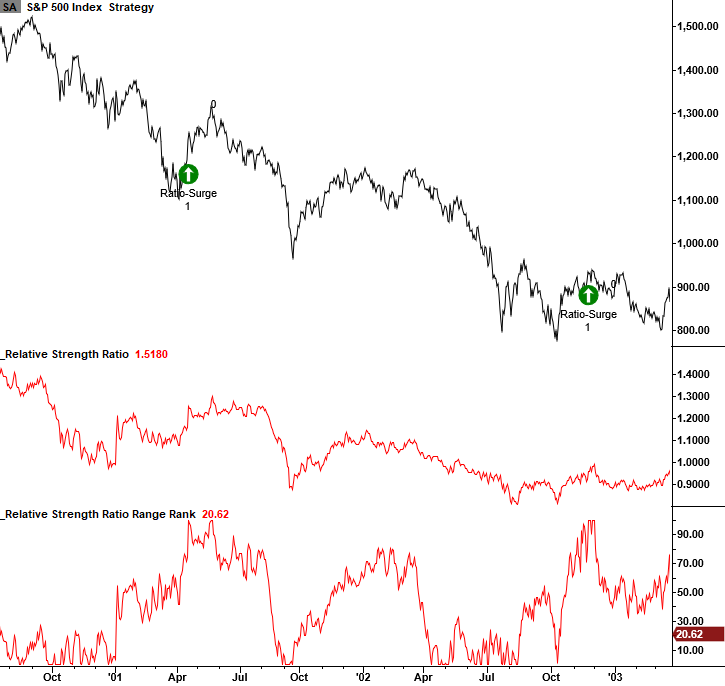
2000-02 bear market chart example
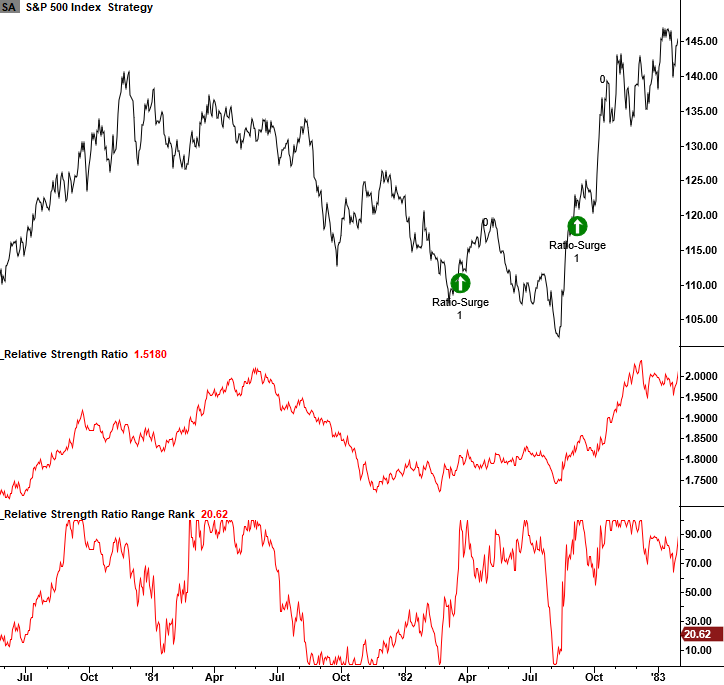
1980-82 bear market chart example
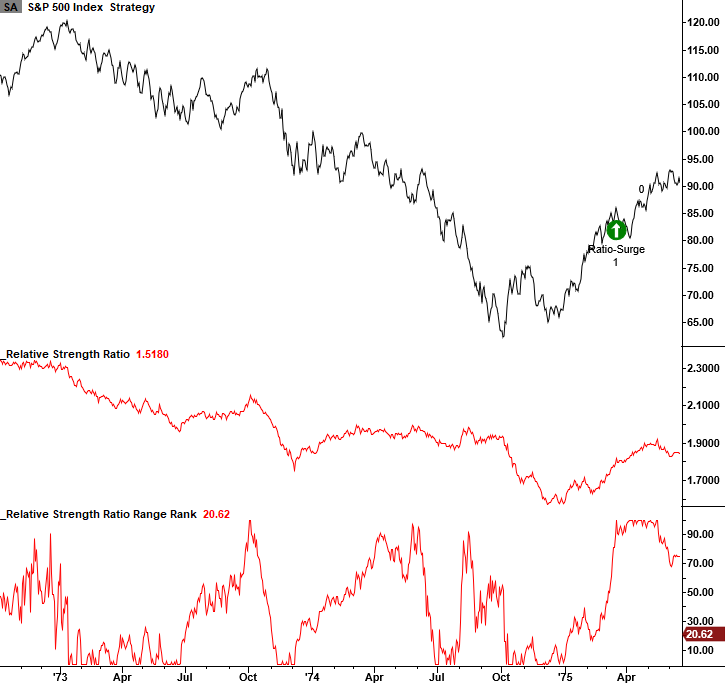
1973-74 bear market chart example
1968-70 bear market chart example
What the research tells us...
When the ratio rank between consumer discretionary and staples sectors increases in favor of discretionary stocks, the cyclical versus defensive relationship can potentially identify a new cyclical uptrend in stocks. Historically, medium and long-term results for the broad market are excellent.