
It's time to put commodities back on the radar - Part I

Key points
- Over the past 90 years, stocks have outperformed commodities by roughly 4-to-1. However, it has not been a constant one-way street, with stock consistently outperforming commodities. Far from it
- A unique long-term cycle suggests that investors and traders should open their minds to the possibility of taking a closer look at commodities, particularly over the next 15 years
- A new cycle begins at the close on 2023-06-30
The 30-year cycle
Before presenting any evidence, let's just put the underlying idea on the table. The idea is this:
- There is a 30-year cycle in the commodities markets
- During the first 15 years, commodities perform significantly better on an absolute basis and significantly outperform the stock market on a relative basis
- During the second 15 years, commodities perform nowhere near as well on an absolute basis and significantly underperform the stock market on a relative basis
As you will see shortly, the good news is that history bears out this pattern, and the newest cycle begins on 2023-06-30. The bad news is that there is no guarantee that these trends will continue, and there is no inference being made that commodity price performance will automatically improve just because July rolls around.
The cycle itself
Looking at the past 90 years of stock and commodity performance, the cycle works like this:
Starting on 1933-06-30, performance favored commodities for the next 15 years and then stocks during the 15 years after that. The pattern and period dates appear in the table below.

How has theory worked in reality to now? Let's take a closer look.
History by the numbers
To measure commodity returns, we use the following month-end prices for the following indexes:
- For commodities, we use the Bloomberg futures index from 1933 to1960 and the Bloomberg Spot Commodity Index from 1960 to the present
- For stocks, we use the monthly closing price for the S&P 500 Index
The table below displays returns for commodities and stocks only during the first 15 years of each 30-year period.
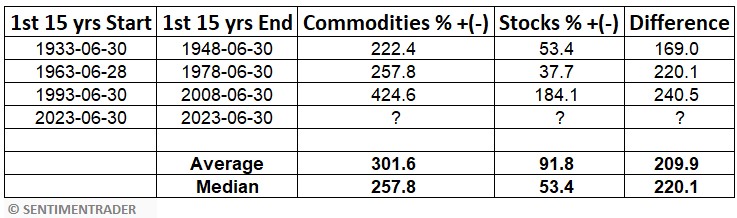
The table above shows that commodities significantly outperformed stocks on each previous occasion. The average 15-year gain for commodities was over +300% versus less than +100% for stocks.
Note also that the next period favoring commodities begins at the close on 2023-06-30.
The table below displays returns for commodities and stocks only during the second 15 years of each 30-year period.
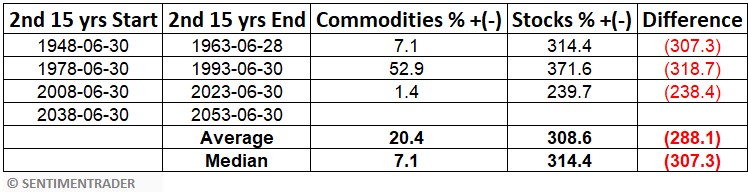
The table above shows that commodities significantly underperformed stocks on each previous occasion. The average 15-year gain for stocks was over +300% versus just +20.4% for commodities. By the end of each of the 15-year periods above - including right now - most traders and investors have entirely dismissed the idea of ever putting money into commodities. This wholesale dismissal sets the stage for the start of the next 30-year cycle.
Note also that the most recent period favoring stocks began at the close on 2008-06-30. The next such period won't start until 2038-06-30.
Putting performance into perspective
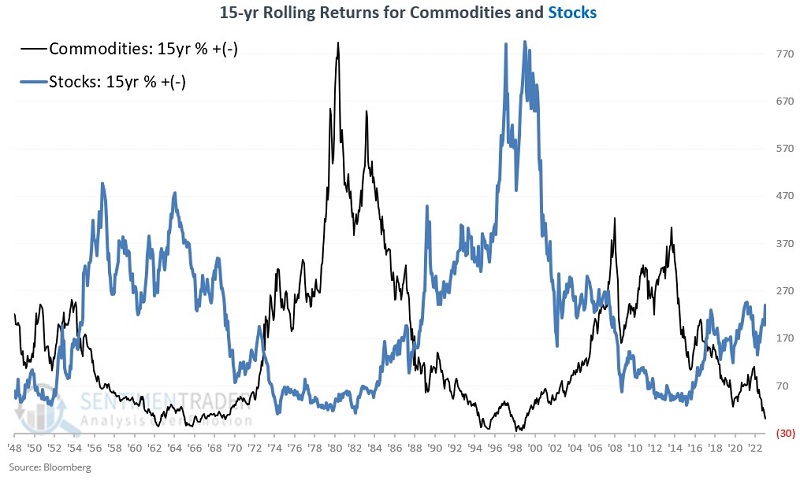
In Part II, we will take a closer look at performance within the actual cycles themselves. But for now, note the stark difference in rolling 15-year percentage returns for commodities and stocks in the chart below. The correlation coefficient is -0.64 (-1.00 would mean they are precisely inverse).
The black line in the chart below measures the cumulative % return for commodities (using the Bloomberg commodity indexes mentioned above) over the previous 15 years at the end of each calendar month. The blue line does the same for stocks (using the S&P 500 Index).
Lastly, to further highlight the stark difference in performance for commodities versus stocks, the chart below subtracts the value for the blue line in the chart above (i.e., the 15-year return for stocks) from the value for the black line in the chart above (i.e., the 15-year return for commodities).
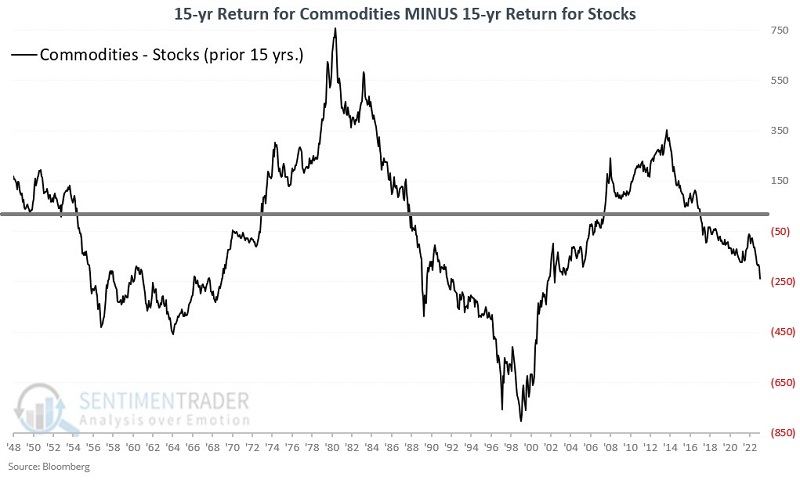
Does anyone notice a pattern?
What the research tells us…
While historical results have been relatively consistent, the implication of the information above is NOT that everyone should sell all their stocks and pile into commodities for the next fifteen years on July 1st. The real purpose is to open investors' minds to potential opportunities. If history proves an accurate guide, individuals who gain exposure to commodities as an asset class during the next fifteen years may vastly outperform those who stick exclusively to stocks. In the following installments, we will take a closer look at intraday cycle performance for commodities and stocks and highlight some ways to potentially take advantage of the long-term back-and-forth nature of performance for these two asset classes