
It's time to keep an eye on the retailing sector

Key points
- The bad news: The retailing sector is technically unchanged from its level of three years ago
- The good news: The sector has recently gained momentum and is threatening to break out of its extended range to the upside
- This occurs just as ticker XRT enters one of the most seasonally favorable periods of the year
The retailing sector has cycled into an uptrend
I have a particular philosophy when it comes to chart patterns. While I look at price charts a lot - mostly looking for trends or a lack thereof - one concern is the tendency for people to "see what they want to see" on a price chart. A long time ago, while teaching trading at seminars, I would hand out an unmarked price chart to each attendee with the following simple directive - "Draw on this chart the most relevant trend lines and/or chart patterns that you see."
No two charts ever ended up looking the same. I concluded that "chart reading" is an art form, not a science (though plenty of chartists disagree with that opinion).
With that said, the Stan Weinstein classic "Secrets for Profiting in Bull and Bear Markets" that leaned heavily on "stage analysis" still resonates (though very often, two traders can still label the same stock to be in different phases). A classic case of the four stages (1=Basing, 2=Advancing, 3=Distribution, 4=Declining) may be playing out in retail. The two charts below show a price chart for the SPDR S&P Retail ETF (ticker XRT). One is the plain price chart, and the other purports to discern the four stages of trend analysis (to the best of my ability).
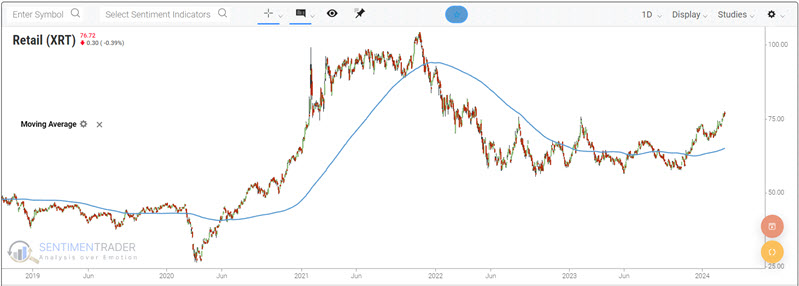
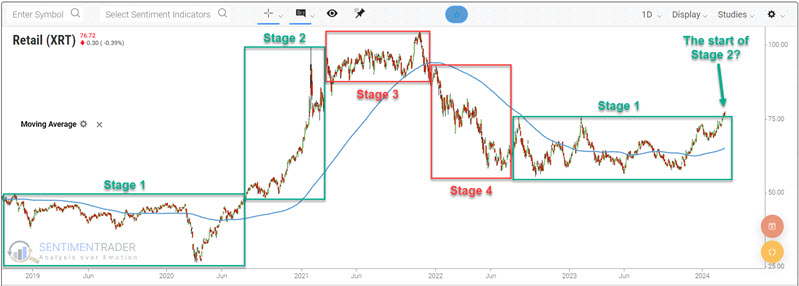
Right now, chances are good that some dedicated chartists are looking at the second chart above and thinking, "he drew it wrong!" As I said, charting (in my opinion) is something of an art form.
More importantly, on the far right-hand side of the charts above, we see XRT attempting to break out to the upside. The implication is (or could be) that it may be in the early stages of a Stage 2 advance, having just recently broken above the high of the Stage 1 base that's been forming over the last year and a half.
Is retail about to run? We cannot predict with any certainty. But one other factor suggests it is possible.
Seasonality entering a favorable period
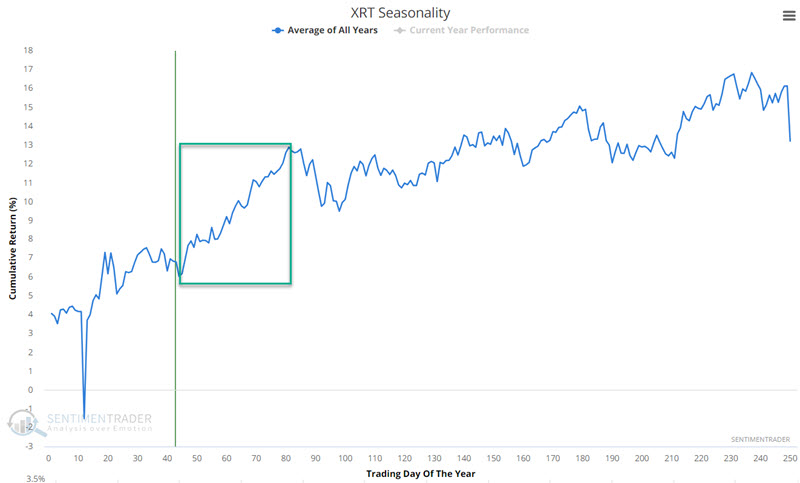
The chart below displays the annual seasonal trend for ticker XRT. You see highlighted a favorable seasonal period that extends from the close on Trading Day of Year (TDY) #44 through the close on TDY #81.
For 2024, this period for XRT extends from the close on 2024-03-05 to the close on 2024-04-26.
A close look at XRT performance
The chart below displays the growth of $1 invested in ticker XRT only from TDY #44 through TDY #81 every year since XRT started trading in 2006.

The quick glance takeaway is "great early on, not much to write home about in the last decade."
The table below summarizes XRT's performance during this seasonal period.
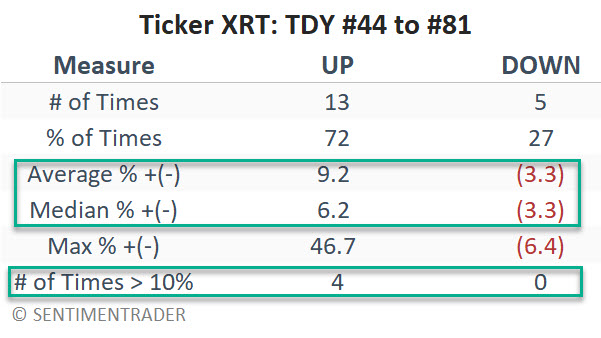
Overall, the historical numbers skew heavily to the favorable side. But again, the last decade has been mostly hit-or-miss, and retailing did get hammered in the Covid-19 sell-off in 2020. So, is there really any "there" there? Let's consider a sector mutual fund with a more extended performance history.
A close look at FSRPX performance
The Fidelity Select Retailing Portfolio mutual fund (ticker FSRPX) is an actively traded fund that does not track a passive index. With that caveat in mind, as it started trading on 1985-12-31, it offers a more extended history of results to evaluate.
The chart below displays the growth of $1 invested in ticker FSRPX only from TDY #44 through TDY #81 every year since 1986.
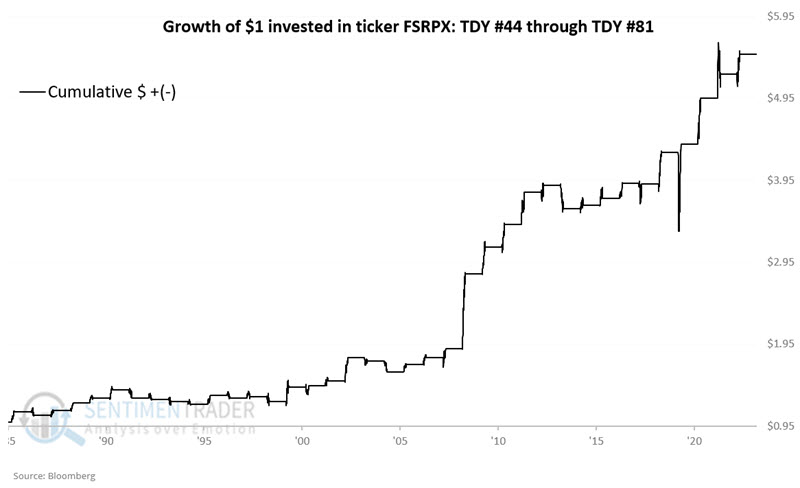
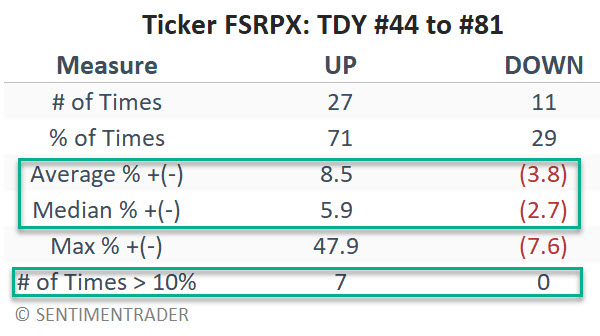
The table below summarizes FSRPX's performance during this seasonal period.
What the research tells us…
On the one hand, we could argue that the retailing sector is a) entering one of the most seasonally favorable times of the year, and b) it is also breaking out into a new Stage 2 advance (which promises significantly higher prices). It all sounds pretty promising. But the reality remains that no seasonal pattern is ever guaranteed to follow its historical norm, and all XRT has to do is dip in price slightly, the purported "Stage 2" breakout will evaporate, and the ETF sinks back into a trading range.
The good news is that long-term, seasonal results skew to the favorable side for both XRT and FSRPX (72% and 71%, respectively). Likewise, regarding moves greater than 10% during the TDY #44 to #81 period, XRT is 4 and 0, and FSRPX is 7 and 0. The worst TDY #44 to #81 decline for XRT was -6.4% in 2020 and -7.6% for FSRPX in 2005.
The bottom line is that Momentum traders should be looking for an opportunity in the retail sector over the next several months.