
Its time to keep an eye on the Nasdaq Unweighted Index

Key points
- A recent article highlighted a strategy that switches between the S&P 500 Index and the S&P 500 Unweighted Index based on the time of year
- This piece considers a similar approach using the Nasdaq 100 Index versus the Nasdaq 100 Unweighted Index
- The results have been compelling and consistent - however, the test period is relatively short, and the future remains unknowable
Equal weight seasonality is noteworthy
In an article dated 2024-10-22, I highlighted the tendency for the S&P 500 Index to outperform the S&P 500 Equal-Weight Index during a certain period of the year and vice versa. Here, we will focus on the Nasdaq 100 Index and the Nasdaq 100 Equal-Weight Index. The Nasdaq 100 Index is cap-weighted and is therefore more heavily influenced by the performance of the largest companies in the index. As the name implies, the equal-weight index gives equal weight to each stock in the index.
Note that the data history is relatively short, starting in 2005. For testing purposes, we will use the following ETFs:
- Invesco QQQ Trust (ticker QQQ)
- First Trust NASDAQ-100 Equal Weighted Index Fund (ticker QQEW)
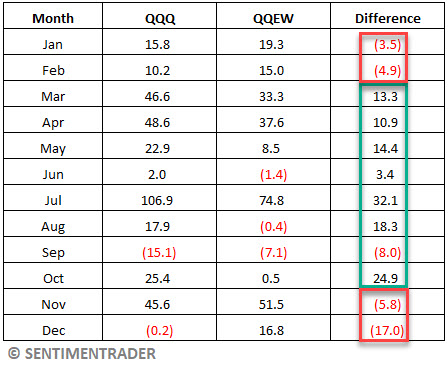
The relationship between ticker the NASDAQ 100 and the NASDAQ 100 Equal Weight Index has a calendar quirk. Over the years tested, the original cap-weighted Nasdaq 100 Index has outperformed the equal-weight version from March through October and underperformed the equal-weight version from November through February.
The chart below displays the hypothetical growth of QQQ vs. QQEW only during November through February, starting in 2005.
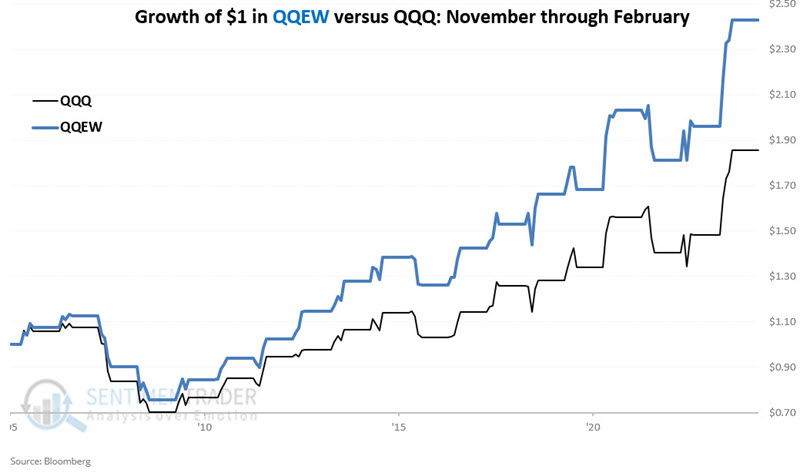
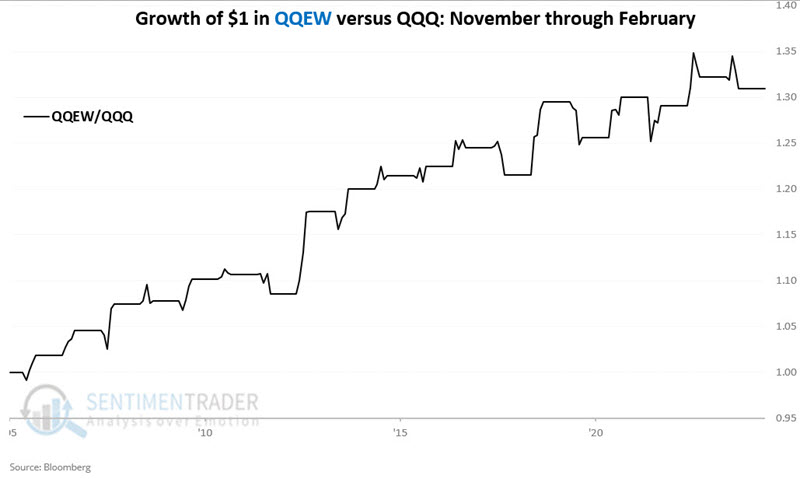
$1 in QQEW only from November through February has grown to $2.43, and $1 in QQQ to $1.85. The chart below shows the growth of $1 invested in QQEW divided by the growth of $1 invested in QQQ only during November through February. While year-to-year results can vary widely, the tendency is clearly lower left to upper right (i.e., QQEW outperforming during these months).
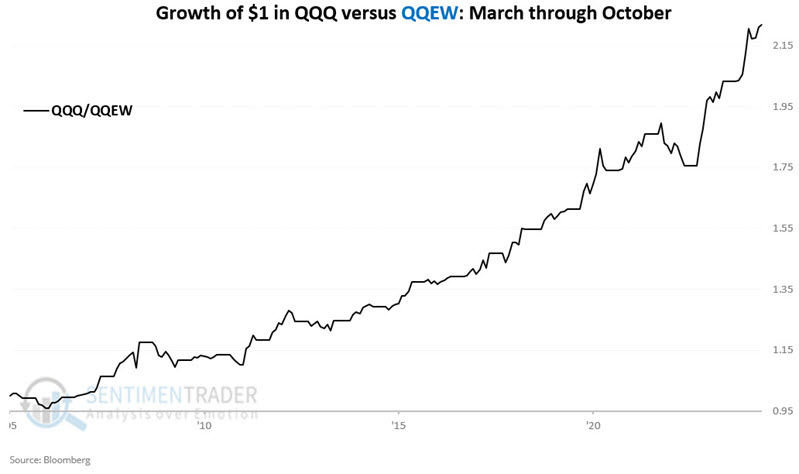
The chart below displays the hypothetical growth of QQQ vs. QQEW only from March through October.
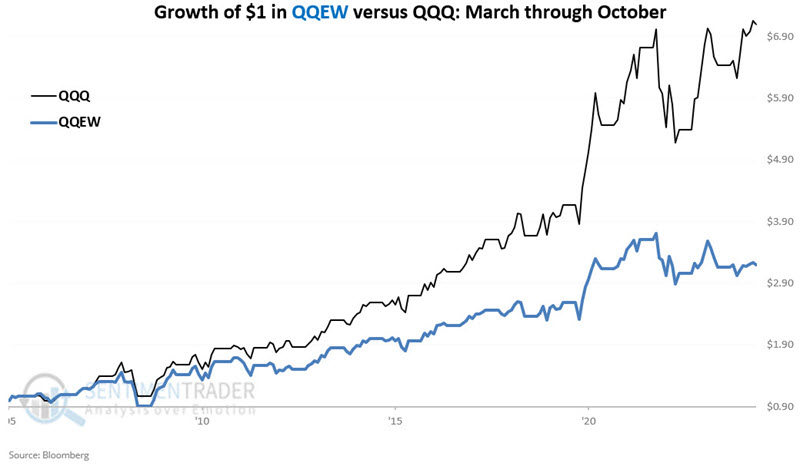
$1 invested in QQQ only from March through October has grown to $7.09; in QQEW, it has grown to $3.19. The chart below shows the growth of $1 invested in QQQ divided by the growth of $1 invested in QQEW only from March through October. Again we see a clear tendency for one index (Nasdaq 100) to outperform the other (Nasdaq 100 Equal-Weight) during the months considered.
The critical point is that, come November 1st, the seasonal odds again swing back in favor of QQEW.
Putting seasonality together
The seasonality approach detailed below involves always being fully invested in one index or the other. Now, let's do the following:
- If the current month is November through February, we will hold the NASDAQ 100 Unweighted Index (QQEW)
- If the current month is March through October, we will hold the NASDAQ 100 Index (QQQ)
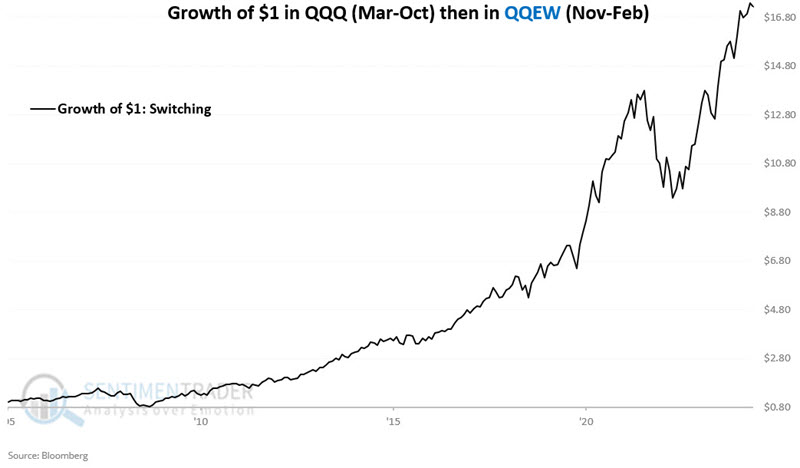
The chart below displays the hypothetical growth of $1 utilizing the rules above. $1 grew to $17.28 by the end of October 2024.
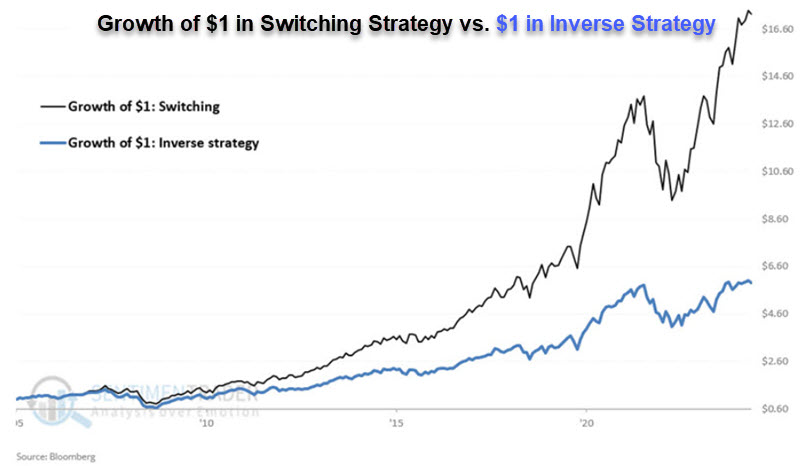
The chart below displays the same line as the chart above in black and shows the growth of $1 using the inverse strategy (i.e., long QQQ November through February and long QQEW March through October).
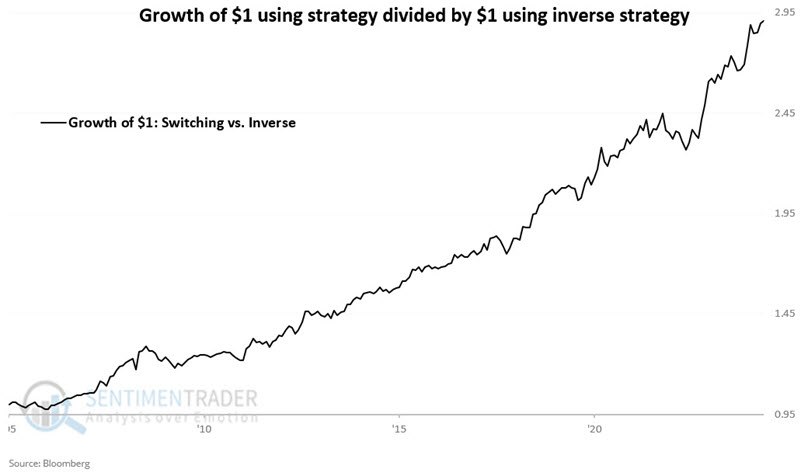
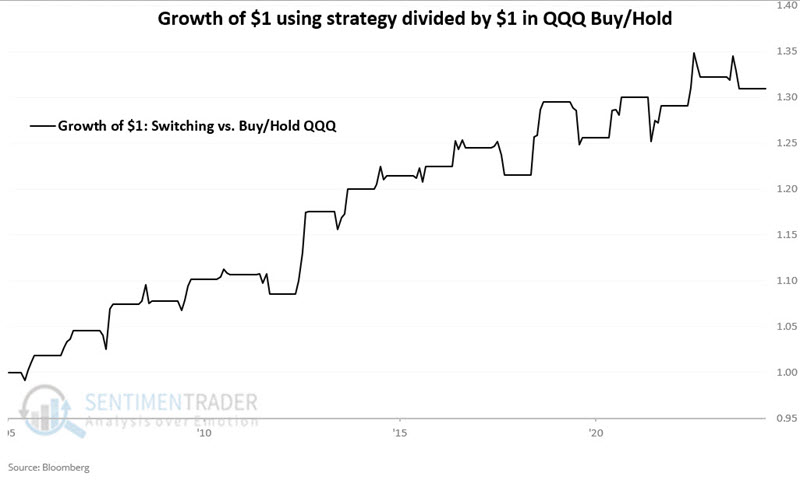
The chart below displays the relative performance between the switching and inverse strategies.
The chart below displays the growth of $1 using the switching strategy as the black line and the growth of $1 invested in ticker QQQ on a buy-and-hold basis in blue.
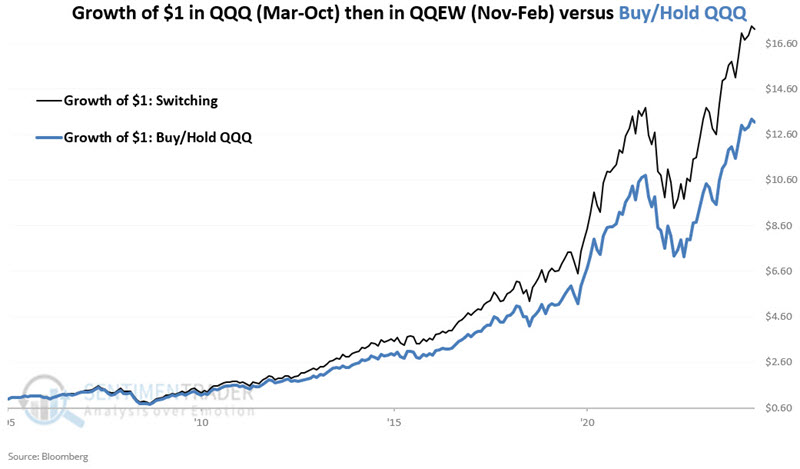
The chart below displays the relative performance between the switching and inverse strategies.
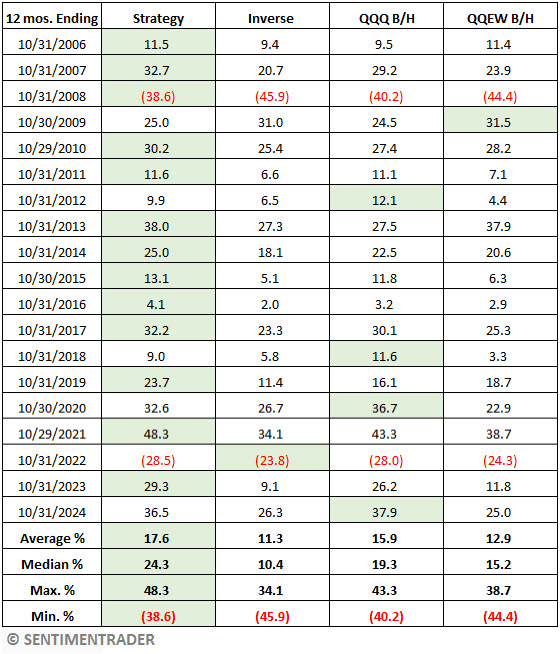
The table below displays the 12-month performance for each of the following approaches:
- Strategy: Long QQEW November through February, long QQQ March through October
- Inverse: Long QQQ November through February, long QQEW March through October
- QQQ B/H: Holds QQQ
- QQEW B/H: Holds QQEW
The table below measures 12-month performance at the end of October each year.
What the research tells us…
The history for the test above is relatively short. However, the results have been consistent enough to prove compelling. One potential flaw of the "strategy" described above is that it is always 100% invested in the market. The history of Nasdaq performance makes this a high-risk, high-reward strategy. Above-average gains are possible over time, but significant losses can occur anytime the Nasdaq experiences a bear market. Note that from 1990 to 2000, the Nasdaq 100 Index gained over +2,860%. In the subsequent 2000-2002 bear market, the Nasdaq 100 Index lost a staggering -83%. Still, for long-term investors, the strategy detailed above does offer the potential for outperformance (versus simply buying and holding the Nasdaq 100 Index) over time.
For better or worse, the above strategy favors the equal-weighted NASDAQ 100 index between now and the end of February 2025.