
It's time to keep an eye on the Equal-Weight S&P 500 Index

Key points
- Since early 2023, the cap-weighted S&P 500 index has significantly outperformed (+50%) the equal-weighted version (+24%)
- It is dangerous to try to predict a reversal in any trend or market relationship
- That said, a couple of longer-term tendencies suggest keeping an eye on the unweighted index in the months ahead
An Equal-weight thrust typically follows through
Momentum is an important factor in the stock market. Sometimes, a momentum signal occurs, and many investors first think, "It's too late to get in because the market has gone too far already." And then the market just keeps going.
Consider the following:
- Let's buy and hold the S&P 500 Equal Weight Index for 252 trading days after it has rallied 35% from a low for the first time in over a year
Right there, many investors will think, "Wait, 35%!? That's too late." But is it? Let's take a closer look.
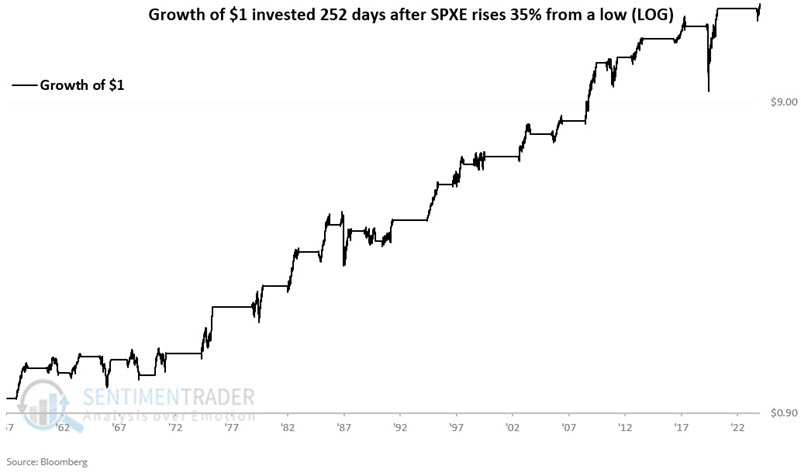
The chart below displays the hypothetical growth of $1 (on a logarithmic scale) invested in the S&P 500 Equal-Weight Index (SPXE) for 252 days after the index rallied 35% from a low. The most recent signal occurred back on 2024-07-24. Since then, the SPXE has advanced +7.8%.
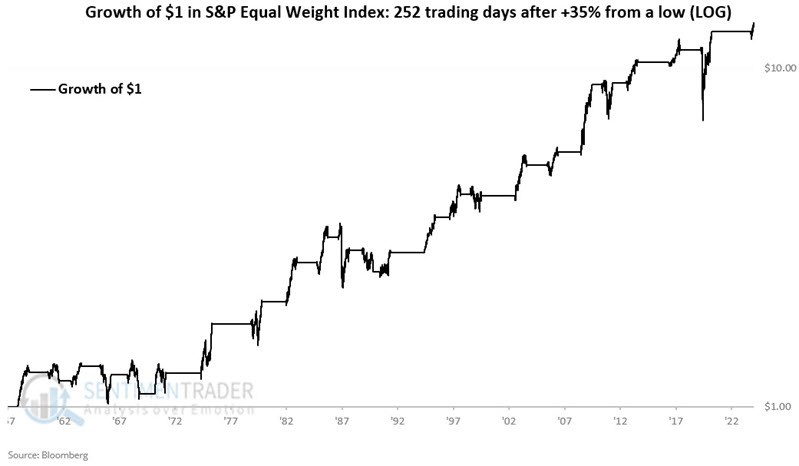
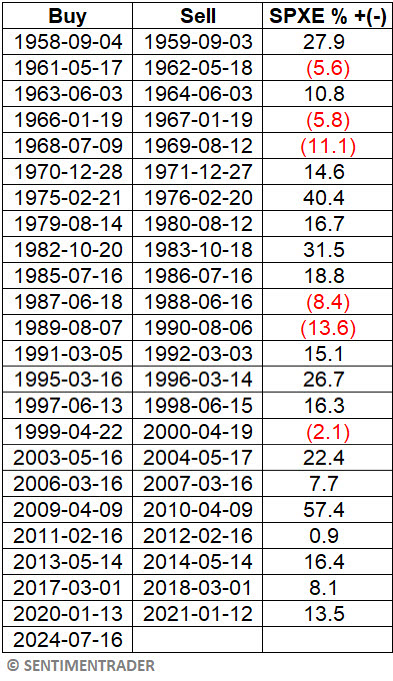
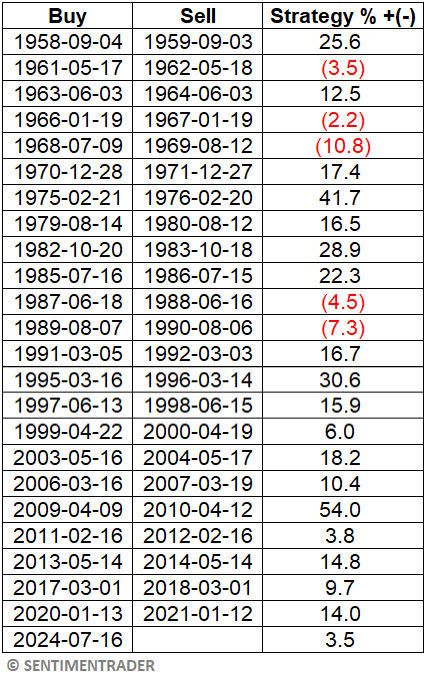
The equity curve is by no means a "straight line advance," but the steady upward "lower left to upper right" nature of results is apparent to the naked eye. The table below displays signal-by-signal results for SPXE.
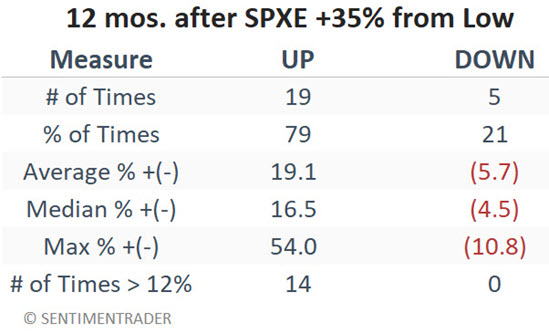
The tables below summarize SPXE's performance in the year after it first gained +35% from a low for the first time in over a year.
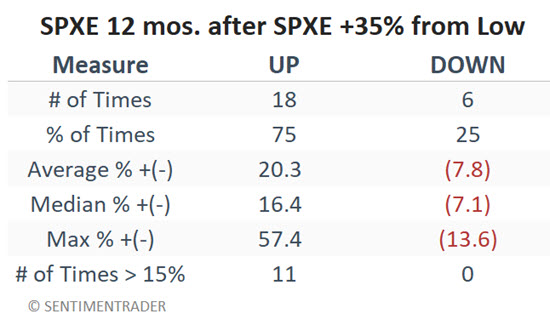
The bottom line: A continuation following a 35% advance from a low is not a sure thing (75% Win Rate). However, long-term results skew strongly to the favorable side (Median Win +16.4%, Median Loss -7.1%, and moves of 15% or more skew positive 11 to 0).
Equal weight seasonality is noteworthy
The relationship between the S&P 500 and the S&P 500 Equal Weight Index has a calendar quirk. Over the years, the equal-weight version has significantly outperformed the original cap-weighted index from November through May and underperformed from June through October.
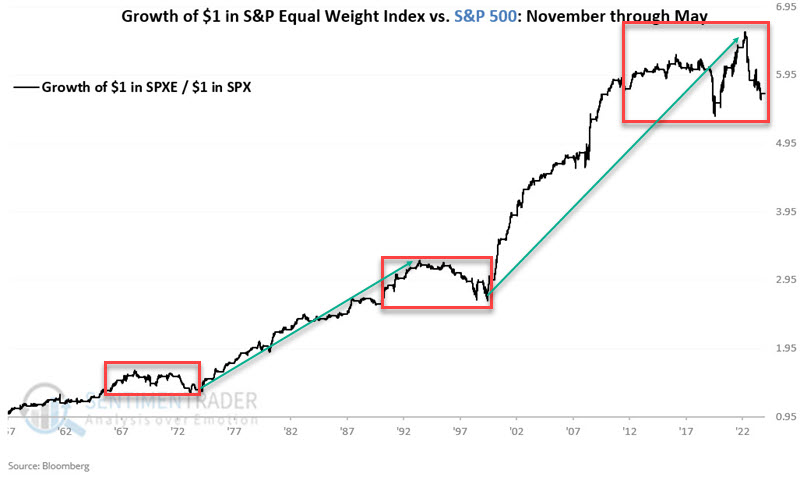
The chart below displays the hypothetical growth of SPXE vs. SPX only during November through May, starting in late 1957.
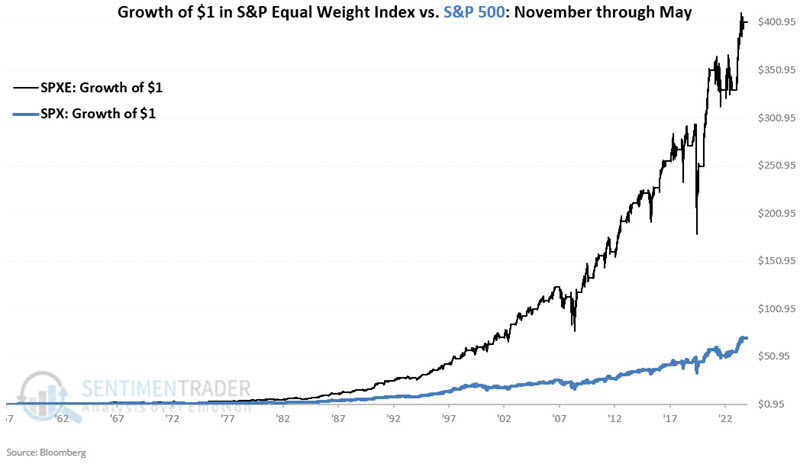
$1 in SPXE only from November through May has grown to $401, and $1 in SPX to $71. The chart below shows the relative performance over the years. Note that SPXE's relative performance has been weak in recent years. However, this type of occasional underperformance is not uncommon and has been followed by a strong surge in subsequent years.
The chart below displays the hypothetical growth of SPXE vs. SPX only from June through October.

$1 in SPXE only June through October has grown to $1.22; in SPX, it has grown to $2.13. The chart below shows the relative performance over the years. SPXE's relative performance has been consistently weak since the early 1990s.
The critical point is that, come November 1st, the seasonal odds again swing back in favor of SPXE.
Putting momentum and seasonality together
The momentum play detailed above generally only occurs every two to five years. The seasonality approach detailed above involves always being fully invested in one index or the other, which would have involved riding out four separate drawdowns of -39% to -57% over the years. So now, let's consider combining momentum and seasonality into more of a trading approach.
Now, let's do the following:
- If the S&P 500 Unweighted Index rises 35% from a low, we will hold a long position for 252 trading days
- If the current month is November through May, we will hold the S&P 500 Unweighted Index
- If the current month is June through October, we will hold the S&P 500 Index
The chart below displays the hypothetical growth of $1 utilizing the rules above.
The table below displays the signal-by-signal results.
The table below summarizes signal results.
ETF alternatives for real-world trading purposes
Strategies involving the S&P 500 cap-weighted and equal-weighted indexes can be emulated with ETF. There are many S&P 500 index versions. The most heavily traded is the SPDR S&P 500 Trust (ticker SPY). The most prominent ETF for trading the equal-weight version is the Invesco S&P 500 Equal Weight ETF (ticker RSP).
What the research tells us…
This is a good time to invoke:
Jay's Trading Maxim #40b: No style, sector, index, or asset EVER holds a permanent advantage.
Trying to time precisely when one asset will begin outperforming (or underperforming) another is difficult at best. Still, once one accepts that, eventually, every market relationship will change, it becomes easier to recognize potential relative strength shifts and take advantage of better performance in one asset over another. Now seems an excellent time to keep a close eye on the relationship between the cap-weighted and equal-weighted S&P 500 indexes.