
It's time to keep an eye on t-bonds

Key points
- T-bond futures have displayed a surprisingly consistent intrayear seasonal pattern
- Playing the long side during favorable periods and the short side during unfavorable periods appears to hold great promise for t-bond traders
- The caveat is that seasonal performance can vary widely from year-to-year
The annual seasonal trend for t-bond futures
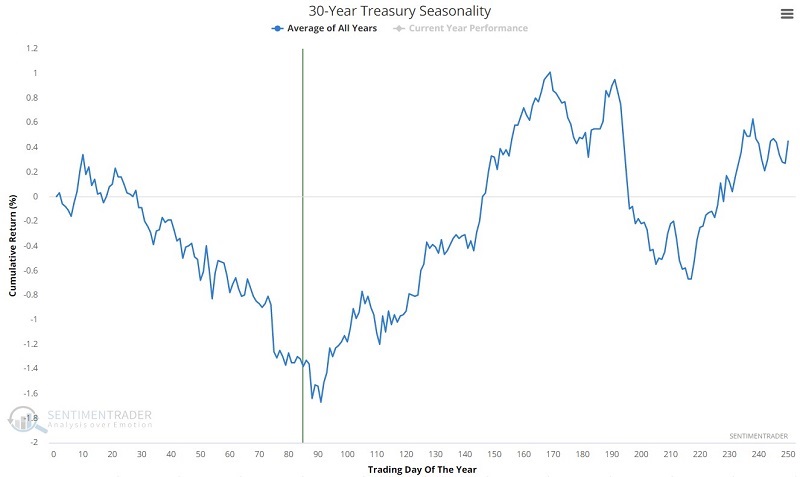
Various seasonal factors are starting to line up on the favorable side (see here and here). Soon the annual seasonal trend will join the parade. Does this guarantee a rally in t-bonds? Not at all. But it does alert beaten-down bond traders and investors to pay attention and to keep an open mind regarding the potential bullish case for bonds. Let's take a closer look.
The chart below displays the annual seasonal trend for t-bond futures.
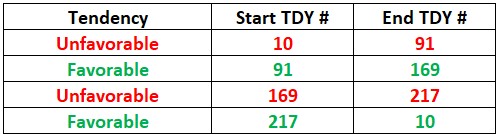
The table below displays these favorable and unfavorable periods using Trading Day of the Year (TDY).
The chart below highlights the primary favorable and unfavorable periods.
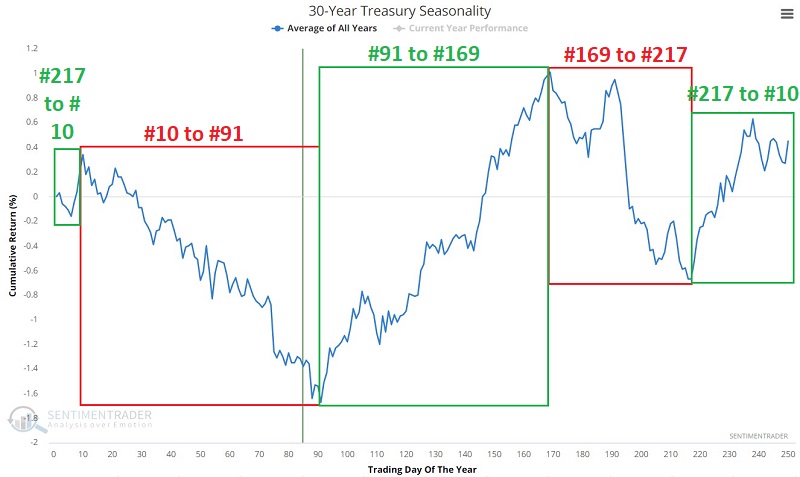
As always, seasonal trends are "climate, not weather," and actual performance can vary widely from year-to-year. It is also essential to remember that the pattern shown in the charts above represents an average of what has happened in the past and is not a "roadmap" for the future.
For testing, we use a continuous futures contract from Bloomberg that tracks the daily change in the price of t-bond futures. Each one point of price movement is worth $1,000. We started the testing at the close of TDY #10 in 1978.
A closer look at favorable periods
Let's look at the two favorable periods shown in the table above.
The chart below displays the hypothetical cumulative $ +(-) from holding a long position in t-bond futures only from the close of TDY #91 through TDY #169 each year starting in 1978. For 2023 the next favorable period extends from the close on 2023-05-09 through 2023-08-25.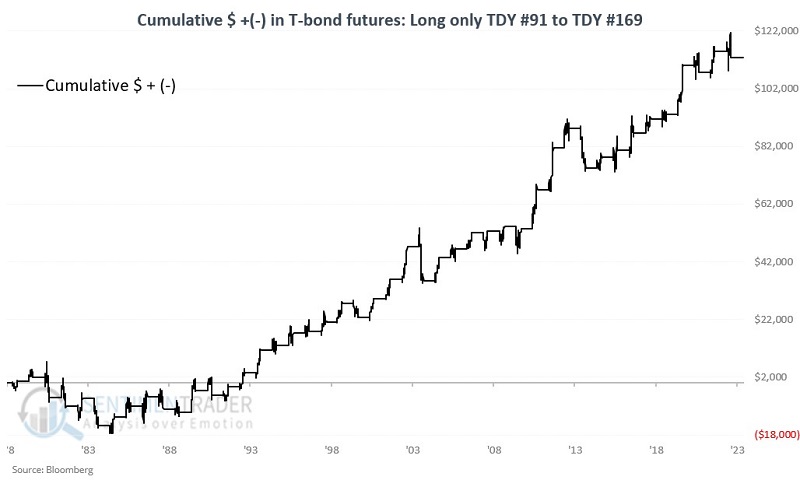
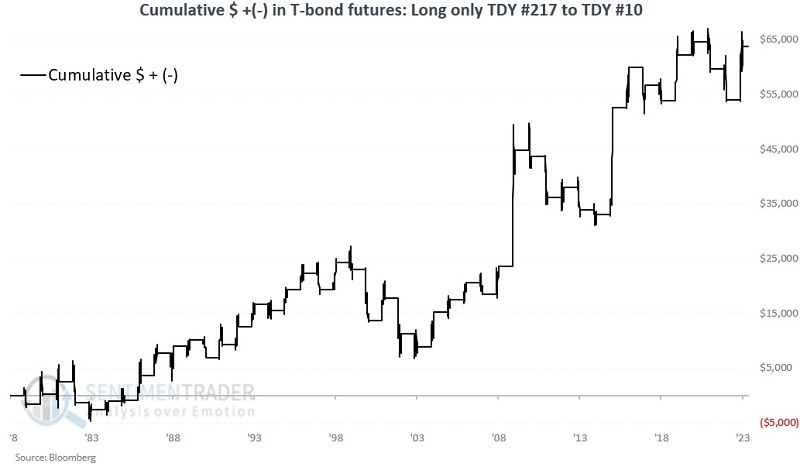
The chart below displays the hypothetical cumulative $ +(-) from holding a long position in t-bond futures only from the close of TDY #217 each year through the close of TDY #10 of the following year.
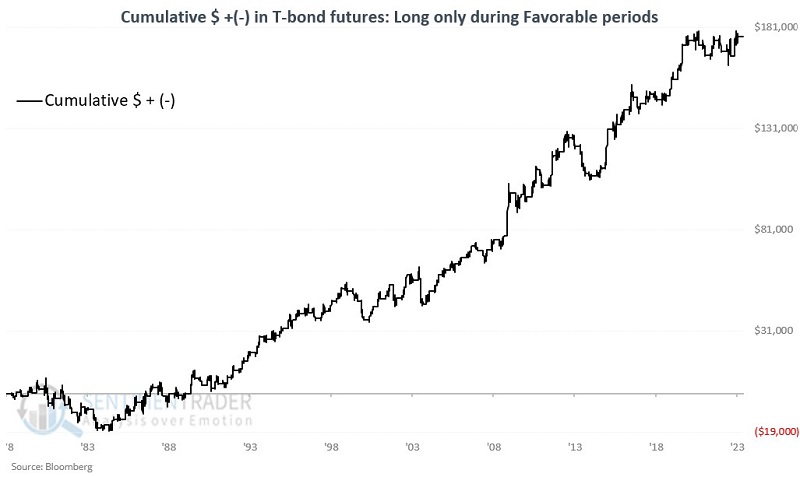
The chart below combines the two periods above and shows the performance of t-bond futures only during the two favorable periods each year.
A closer look at unfavorable periods
Let's look at the two unfavorable periods shown in the table above.
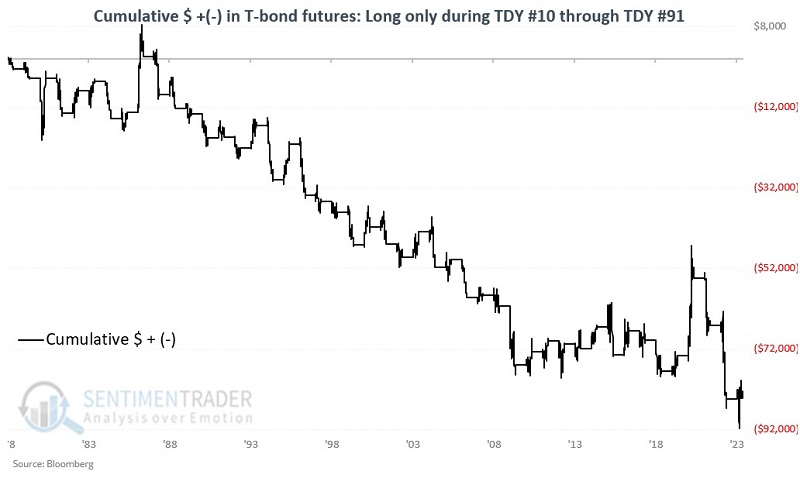
The chart below displays the hypothetical cumulative $ +(-) from holding a long position in t-bond futures only from the close of TDY #10 through TDY #91 each year starting in 1978.
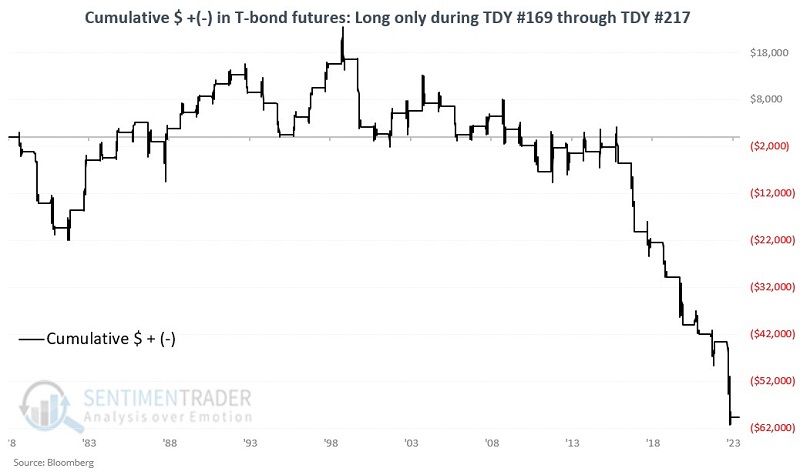
The chart below displays the hypothetical cumulative $ +(-) from holding a long position in t-bond futures only from the close of TDY #169 through TDY #217.
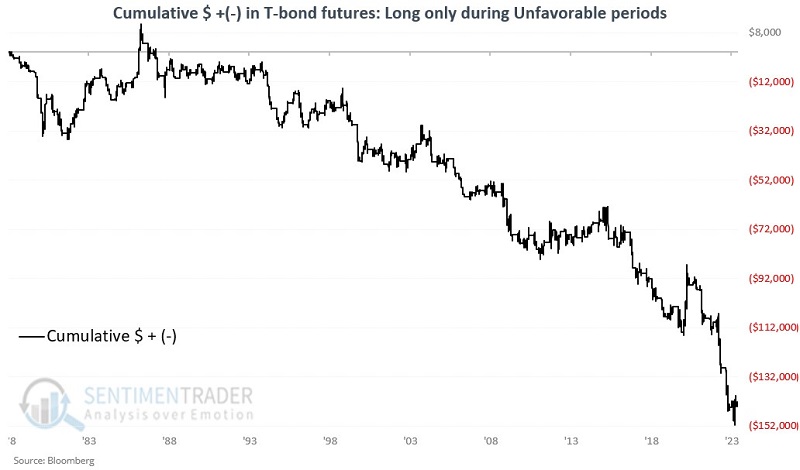
The chart below combines the two periods above and shows the performance of t-bond futures only during the two unfavorable periods each year.
Combining favorable and unfavorable periods
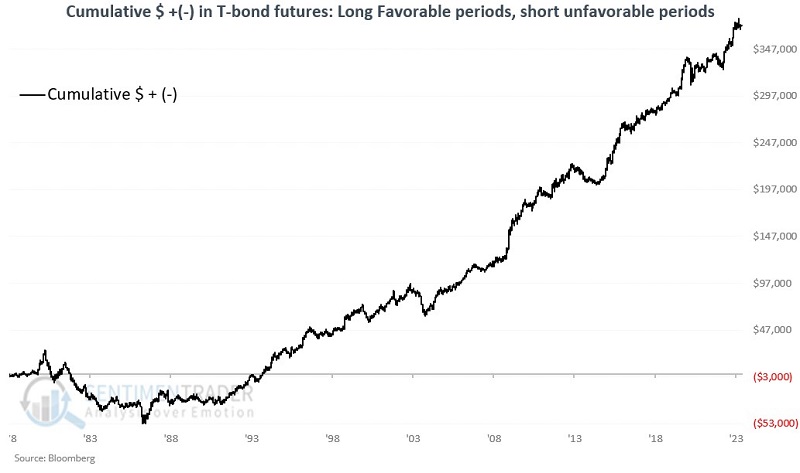
For the next test, we will assume a long position is held in t-bond futures during the two favorable periods each year and that a short position is held during the two unfavorable periods each year. The chart below displays the hypothetical cumulative $ + (-) for t-bond futures using this long/short approach.
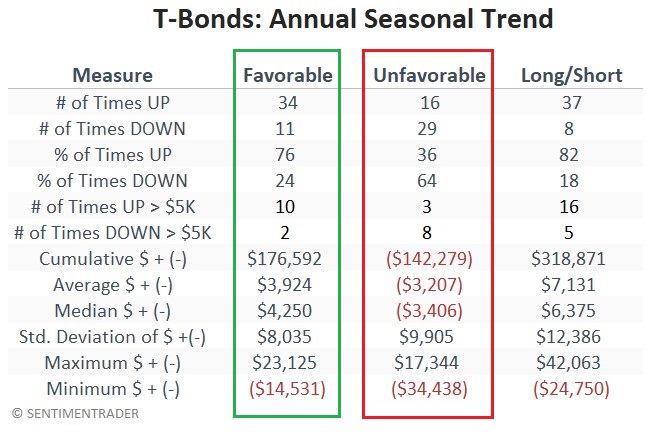
The table below summarizes the annual results for this long/short approach through 2023-05-02.
What the research tells us…
T-bond futures have displayed a historical tendency to show strength during the favorable periods detailed above and weakness during the unfavorable periods. That's the good news. The bad news is that results can vary greatly, and at times the market can and will move significantly in the "wrong" direction (i.e., lower during a favorable period and vice versa). As a result, it is not suggested that this annual seasonal pattern be used as a standalone trading model. The best approach appears to use the current favorable or unfavorable trend status as a guide to tell you what direction to look in. If price action or other favored indicators are positive during a favorable trend, history suggests that a trader might aggressively play the long side of the t-bond market. If price action or other favored indicators are negative during an unfavorable trend, history suggests that a trader might aggressively play the short side of the t-bond market.
Note that the annual seasonal trend will enter a favorable period at the close on 2023-05-09.