
Its time to keep an eye on corn

Key Points
- Corn has entered a favorable seasonal period
- So far, the price trend is not confirming
- However, corn trader sentiment suggests that traders watch closely for a buying opportunity
Corn has entered a favorable seasonal period
The chart below displays the annual seasonal trend for corn futures (blue line) and actual price performance so far in 2024 (red line).
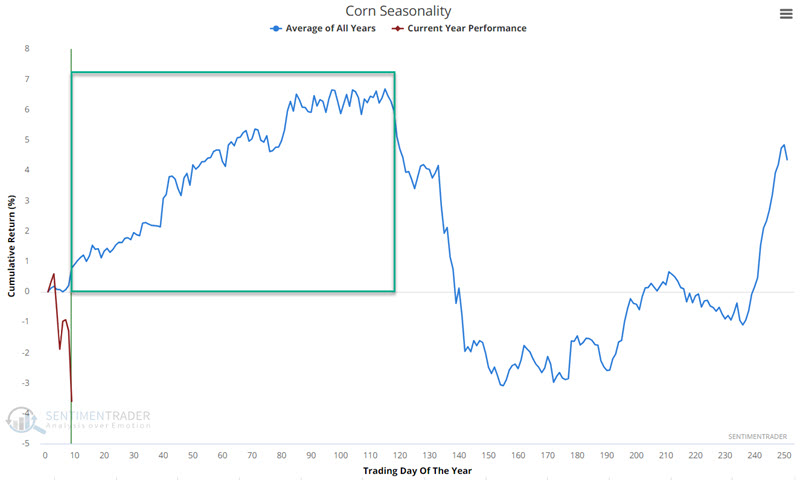
The good news is that a favorable seasonal period extends from Trading Day of Year #6 through TDY #115. For 2024, that period runs from 2024-01-09 through 2024 06-14. The bad news is that there is never a guarantee that corn will, in fact, rally during this period during any given year - and 2024 is off to a lousy start. During the first three days of this period in 2024, corn futures have dropped 12.5 cents per bushel, or -$612.50 in contract value.
So, is this a warning sign that 2024 may be an off-year? Or does this set up a better buying opportunity? The reality is that there is no way to answer that question. A trader must assess the situation, decide whether to trade or not, and manage risk along the way if the answer is to trade.
The chart below displays the hypothetical cumulative $ +(-) achieved by holding a long position in corn futures during TDY #6 through TDY #115 every year starting in 1940.
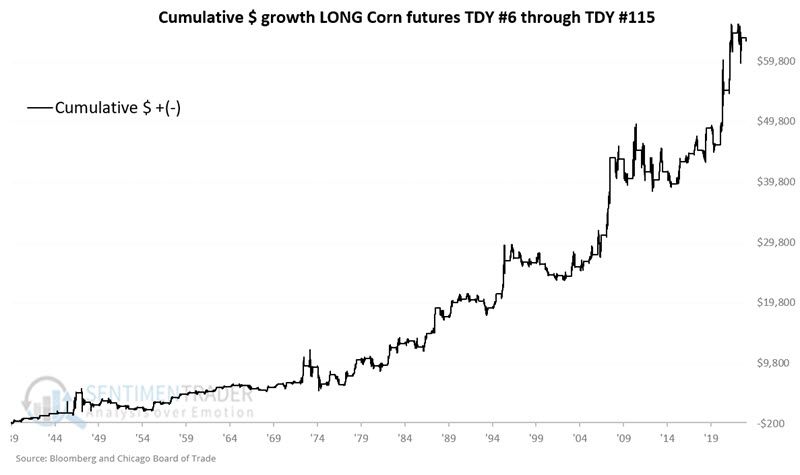
The takeaway from the chart above is that year-to-year results are not certain, but the "lower left to upper right" nature of returns in the long run is obvious.
The table below summarizes corn futures' performance during this favorable seasonal period.
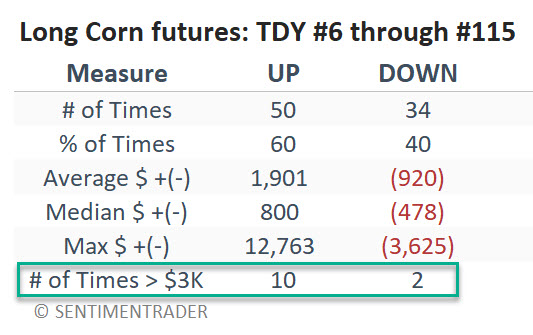
This corroborates what we have seen so far - a reasonable but not spectacular Win Rate (60%), but up-year results significantly outpace down-year results.
This suggests looking for a price trend to confirm or some sign from another indicator that the tide may turn more favorable before getting in. Since the price trend is not cooperating so far, let's look at another indicator that suggests the potential for a turnaround in corn.
Corn traders have turned highly pessimistic
As corn prices have trended lower in the past six months, corn trader sentiment has fallen sharply. It's recently reached a level that has typically seen higher prices six months hence. The chart and table below highlight all dates when our Corn Optix indicator stood at 20% or below.
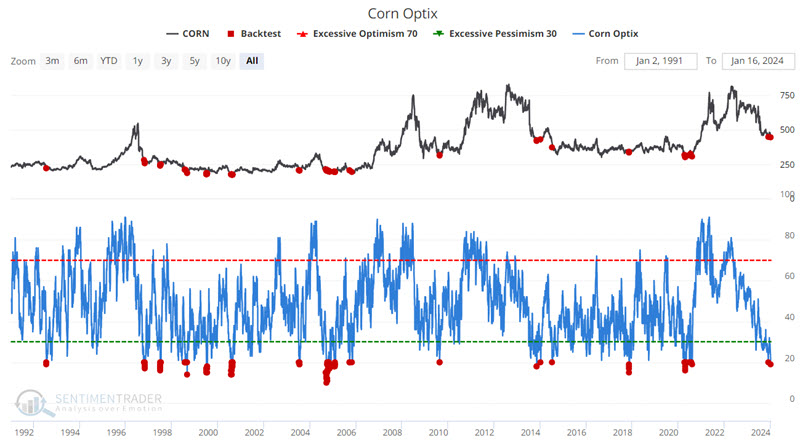
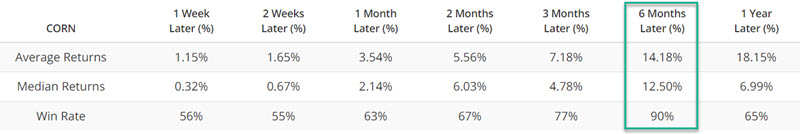
The most recent signals occurred on 2024-01-12 and 2023-11-29. Following previous signals, corn prices stood higher six months later, 90% of the time. This dovetails nicely with the seasonal outlook for corn shown above.
An alternative to corn futures
Traders unwilling to trade corn futures can consider the Teucrium Corn Fund (ticker CORN). Shares of CORN can be bought and sold just like shares of stock in a standard stock brokerage account. Ticker CORN is designed to track the price of corn futures.
What the research shows…
Seasonality should rarely be the sole reason for a trader taking a position. Seasonal trends tell you which direction to look (long or short) regarding a tradable asset. Within that time window, a trader should look for either price confirmation - i.e., price trending in the direction it "should" be trending in, and/or a signal from some other reliable indicator that price may soon reverse into the expected direction. If corn is going to rally within a given calendar year, that typically happens during the first five and a half months (as the uncertainty of planting and growing seasons is at its peak). However, so far in 2024, corn prices have trended lower. The latest action in our Corn Optix indicator suggests higher prices in the next six months. Aggressive traders might consider a long position in anticipation of higher prices. Another alternative is to wait for corn price action to turn the corner and show some sign of confirmation before climbing on board.