Products
SentimenTrader Trading Tools
‍
Backtest Engine
My Trading Toolkit
Correlation Analysis
Seasonality
Market Prediction
Indicators & Data API
‍
Proprietary Indicators & Charts
Market Data API
Strategies & Scanner
‍
50+ Trading Strategies
Smart Stock Scanner
Smart Option Scanner
Research Reports
‍
Research Solutions
Reports Library
Free Resources
Simple Backtest Calculator
Simple Seasonality Calculator
The Kelly Criterion Calculator
Sentiment Geo Map
Public Research Reports
Education
Sentiment Indicators
Technical Indicators
Pricing
Company
About
In the News
Testimonials
Client Success Stories
Contact
Log inLoginSign up
< BACK TO ALL REPORTS

Its time to keep a close eye on platinum

Jay Kaeppel
2023-06-06
Platinum has been mired in a large trading range for over eight years. The combination of an unfavorable seasonal period and a warning sign from trader sentiment suggests that things will not likely improve anytime soon.

Key points

  • Platinum is entering a very unfavorable seasonal period
  • There are no guarantees that platinum will decline during this period in 2023
  • Sentiment has also recently flashed a potential warning sign
  • History strongly suggests avoiding a long position - and considering a short position - in the near-term time frame

Platinum is a highly cyclical market

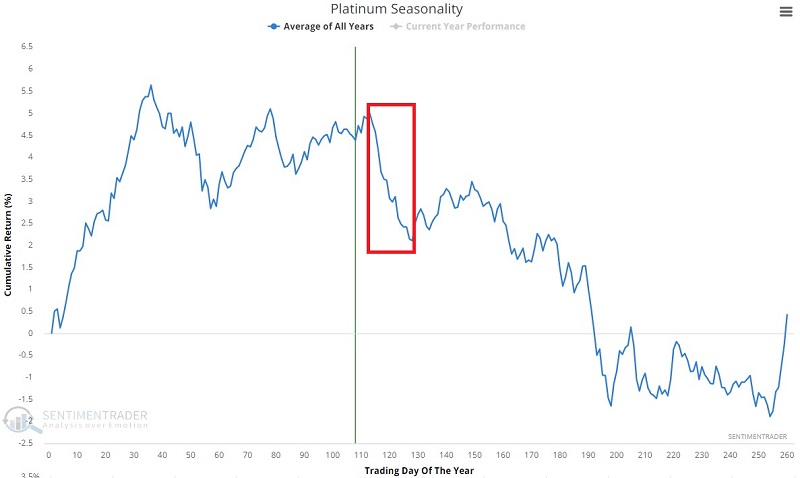
The chart below displays the annual seasonal trend for platinum futures. Highlighted is an unfavorable period that extends from the close of Trading Day of Year (TDY) #113 through TDY #128. For 2023, this period extends from the close on 2023-06-08 through 2023-06-29.

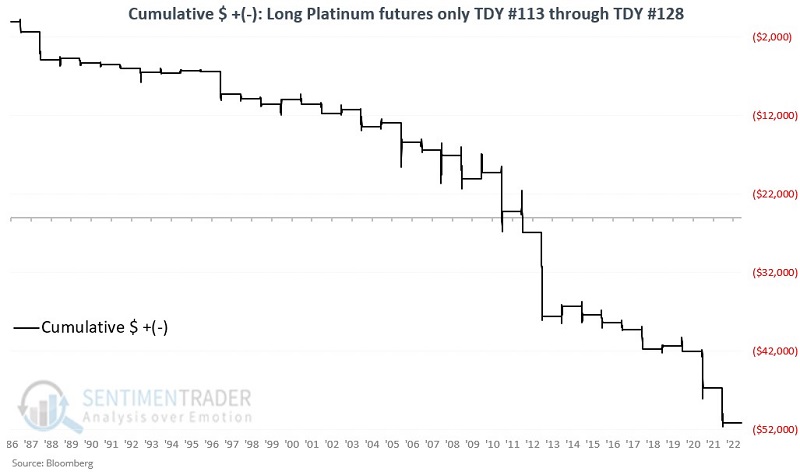
For testing purposes, we will use daily platinum futures data from Bloomberg, using a data series that tracks the spot futures month. The chart below displays the hypothetical cumulative $ +(-) from holding a long position in platinum futures only from the close of TDY #113 through TDY #128 every year since 1987.

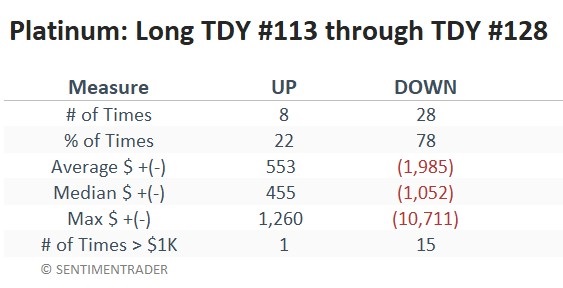
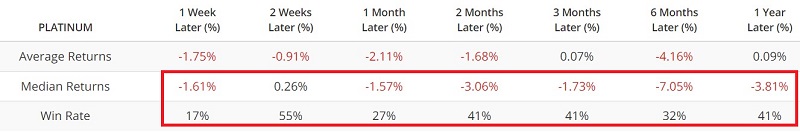
The table below displays a summary of platinum performance only during this period.

As always, seasonality is "climate, not weather." An annual seasonal chart is a look back at average performance, not a roadmap for the current year. Just because an annual seasonal trend chart declines sharply during a given period does not mean the market will do so this year. All that said, the equity curve chart and performance table above suggest that platinum has historically been particularly vulnerable during June.

One measure of sentiment is skewing unfavorable

The chart below highlights with a red dot each date when the 50-day moving average of Platinum Optix crossed above 50% while platinum futures were above their 150-day moving average.

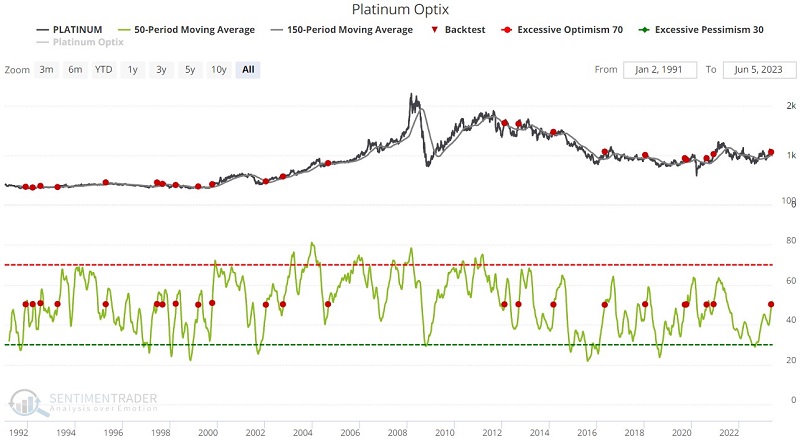
While the results are not uniformly bearish, on many occasions, a nascent rally in platinum ran out of steam shortly after a signal. The most recent unfavorable signal occurred on 2023-05-22, lending more weight to the negative side of the ledger for platinum.

The table below summarizes platinum futures performance following the signal dates.

What the research tells us…

Note that platinum futures have shown a gain during the seasonal period in question 22% of the time in the past. So, it is a mistake to assume that platinum is doomed to fall in the weeks ahead. Nevertheless, the historical results are heavily skewed to the bearish side. Note that in 36 years, a gain above +$1,000 has occurred only once (3% of the time). A loss of -$1,000 or more has happened 15 times (42% of the time). 

Trading is essentially a game of odds. The combination of a most unfavorable seasonal period and a warning from sentiment suggests that traders looking to put the odds on their side in this precious metal should either play the short side or stand aside through late June.

PRODUCTS
SentimenTrader
Trading Tools
Indicators & Data API
‍
Strategies & Scanner
‍
Research Reports
FREE
RESOUrCES
Simple Backtest
Calculator
Simple Seasonality
Calculator
The Kelly Criterion
Calculator
Sentiment Geo Map
‍
Public Research Reports
‍
Education
Sentiment Indicators
‍
Technical Indicators
‍
Pricing
Bundle pricing
‍
FAQ
‍
Announcements
‍
COMPANY
‍
About
‍
In the News
‍
Testimonials
‍
Client Success Stories
CONTACT
‍
General Inquiries
‍
Media Inquiries
‍
Financial Professionals Inquiries
‍
© 2026 Sundial Capital Research Inc. All rights reserved.
Setsail Marketing
TermsPrivacyAffiliate Program
Risk Disclosure: The information and tools provided are for research and analytical purposes only and are not intended as investment advice. Market analysis involves uncertainty, and outcomes may differ from expectations. Users should conduct their own due diligence and consider their individual circumstances before making any financial decisions. Past performance is not necessarily indicative of future results.

Hypothetical Performance Disclosure: Hypothetical performance results have many inherent limitations, some of which are described below. No representation is being made that any account will or is likely to achieve profits or losses similar to those shown; in fact, there are frequently sharp differences between hypothetical performance results and the actual results subsequently achieved by any particular trading program. One of the limitations of hypothetical performance results is that they are generally prepared with the benefit of hindsight. In addition, hypothetical trading does not involve financial risk, and no hypothetical trading record can completely account for the impact of financial risk of actual trading. for example, the ability to withstand losses or to adhere to a particular trading program in spite of trading losses are material points which can also adversely affect actual trading results. There are numerous other factors related to the markets in general or to the implementation of any specific trading program which cannot be fully accounted for in the preparation of hypothetical performance results and all which can adversely affect trading results.

Testimonial Disclosure: Testimonials appearing on this website may not be representative of other clients or customers and is not a guarantee of future performance or success.