Products
SentimenTrader Trading Tools
‍
Backtest Engine
My Trading Toolkit
Correlation Analysis
Seasonality
Market Prediction
Indicators & Data API
‍
Proprietary Indicators & Charts
Market Data API
Strategies & Scanner
‍
50+ Trading Strategies
Smart Stock Scanner
Smart Option Scanner
Research Reports
‍
Research Solutions
Reports Library
Free Resources
Simple Backtest Calculator
Simple Seasonality Calculator
The Kelly Criterion Calculator
Sentiment Geo Map
Public Research Reports
Education
Sentiment Indicators
Technical Indicators
Pricing
Company
About
In the News
Testimonials
Client Success Stories
Contact
Log inLoginSign up
< BACK TO ALL REPORTS

It's getting late in real estate

Jay Kaeppel
2022-08-22
The real estate sector enjoyed a strong eight-week rally off of the June low. Seasonality suggests that there could be one more rally in the works. However, seasonality also suggests that now is not the time to make a major commitment to this sector and that a better buying opportunity often forms during the fourth quarter.

Key Points

  • Real estate has historically been a weak sector during September
  • Using sector index data, we will look at the long-term history of real estate in September
  • Using ETF data, we will also look at a specific period of seasonal weakness

Real estate in September

For testing purposes, our dataset uses monthly total return data for the Fama French database through 1990 and S&P 500 sector data starting in 1991.

The chart below displays the cumulative total return for the real estate sector if held only during September starting in 1926 through 2021. 

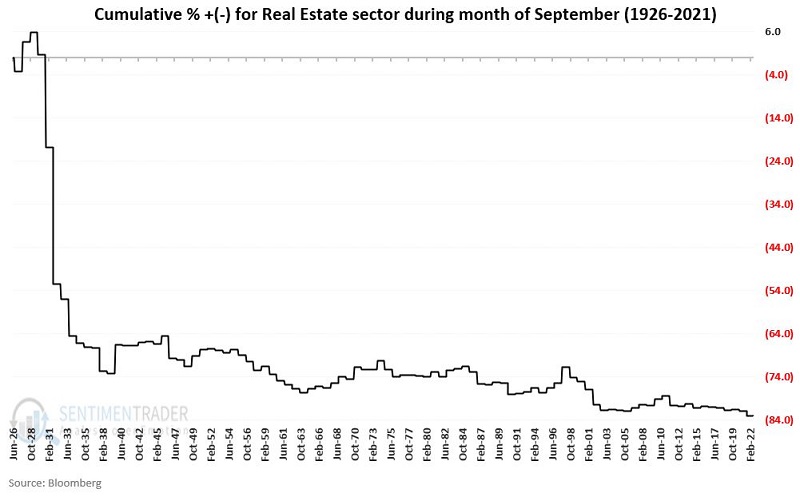
The massive collapse in the early 1930s dominated performance. So, to get a clearer picture, the chart below displays the cumulative total return for the real estate sector if held only during September during the post-WWII period starting in 1945. 

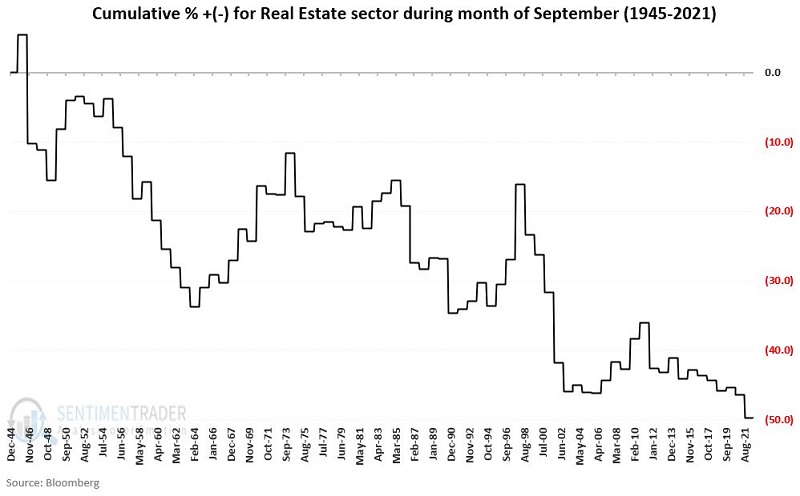
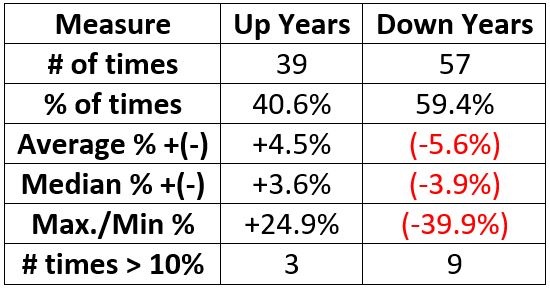
Despite the devastating September results from the 1930s, September has not been a banner month for real estate. The table below displays a summary of September real estate sector performance.

September 1st is just around the corner.

Trading Day of Year with IYR

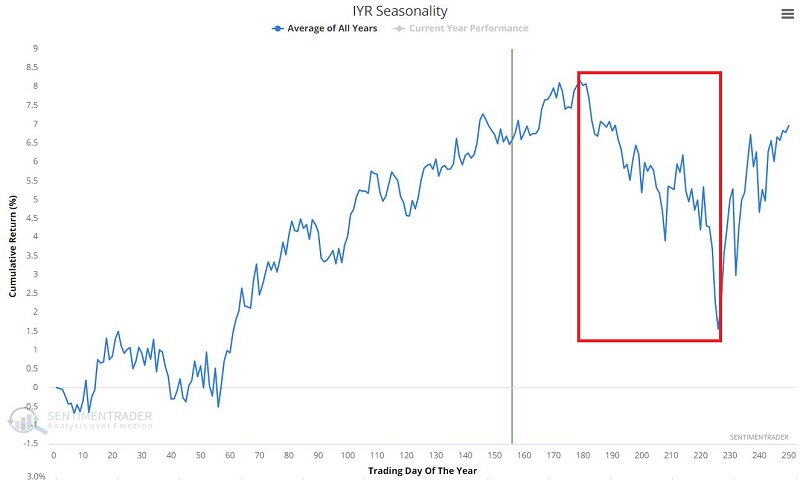
The trouble in the real estate sector often does not begin until later in September and sometimes bleeds well into late fall. The chart below displays the annual seasonal trend for ticker IYR (iShares U.S. Real Estate ETF), which tracks the Dow Jones Real Estate Index. As you can see, there has been a tendency for weakness between trading Day of Year (TDY) #179 and TDY #226. For 2022 this period extends from the close on 2022-09-19 and the close on 2022-11-23.

The chart below displays the cumulative return for ticker IYR if held only during TDY #180 through #226 every year since fund inception. 

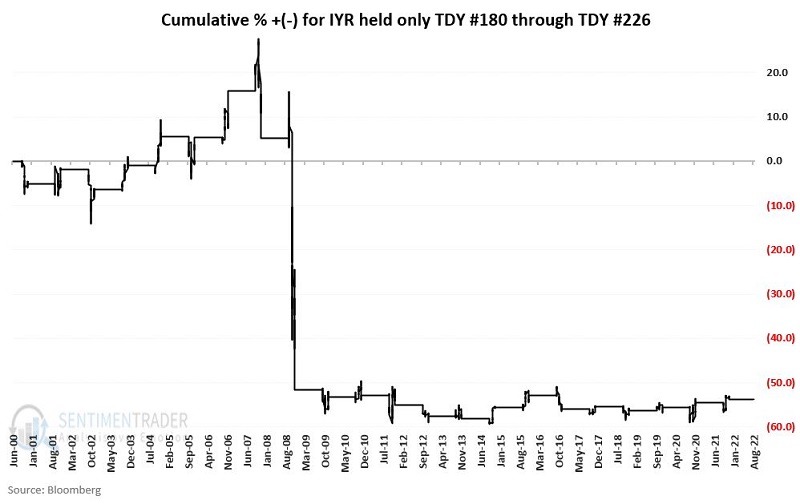
2007 and especially 2008 accounted for most of the net loss. Nevertheless, the more significant point is that not much of anything great happened during this period in other years.

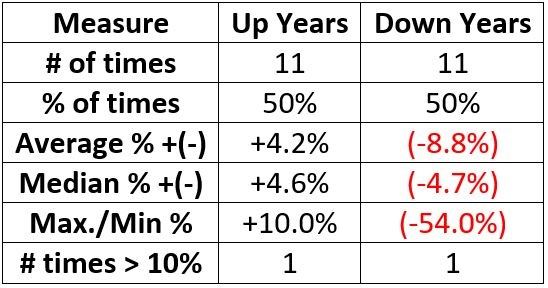
The table below summarizes IYR performance during this seasonally unfavorable period since 2000.

What the research tells us…

The long-term odds of the real estate sector advancing in the next one to three months is basically a coin flip. However, the key point is that when this sector has shown weakness during the fourth quarter, it has tended to be severe. The good news is that a good buying opportunity often forms for real estate during the fourth quarter. Long-term results suggest that investors tread lightly in this sector during the fourth quarter but remain alert for a buying opportunity.

PRODUCTS
SentimenTrader
Trading Tools
Indicators & Data API
‍
Strategies & Scanner
‍
Research Reports
FREE
RESOUrCES
Simple Backtest
Calculator
Simple Seasonality
Calculator
The Kelly Criterion
Calculator
Sentiment Geo Map
‍
Public Research Reports
‍
Education
Sentiment Indicators
‍
Technical Indicators
‍
Pricing
Bundle pricing
‍
FAQ
‍
Announcements
‍
COMPANY
‍
About
‍
In the News
‍
Testimonials
‍
Client Success Stories
CONTACT
‍
General Inquiries
‍
Media Inquiries
‍
Financial Professionals Inquiries
‍
© 2026 Sundial Capital Research Inc. All rights reserved.
Setsail Marketing
TermsPrivacyAffiliate Program
Risk Disclosure: The information and tools provided are for research and analytical purposes only and are not intended as investment advice. Market analysis involves uncertainty, and outcomes may differ from expectations. Users should conduct their own due diligence and consider their individual circumstances before making any financial decisions. Past performance is not necessarily indicative of future results.

Hypothetical Performance Disclosure: Hypothetical performance results have many inherent limitations, some of which are described below. No representation is being made that any account will or is likely to achieve profits or losses similar to those shown; in fact, there are frequently sharp differences between hypothetical performance results and the actual results subsequently achieved by any particular trading program. One of the limitations of hypothetical performance results is that they are generally prepared with the benefit of hindsight. In addition, hypothetical trading does not involve financial risk, and no hypothetical trading record can completely account for the impact of financial risk of actual trading. for example, the ability to withstand losses or to adhere to a particular trading program in spite of trading losses are material points which can also adversely affect actual trading results. There are numerous other factors related to the markets in general or to the implementation of any specific trading program which cannot be fully accounted for in the preparation of hypothetical performance results and all which can adversely affect trading results.

Testimonial Disclosure: Testimonials appearing on this website may not be representative of other clients or customers and is not a guarantee of future performance or success.