
It's (almost) the most real estate time of the year

Key points
- Many are calling for a collapse in housing prices and challenging times for the real estate sector
- Nevertheless, a favorable period for the stock market extends from Trading Day of the Year #226 through the end of the year
- In terms of raw performance, the real estate sector has outgained other sectors by a wide margin
A favorable year-end window
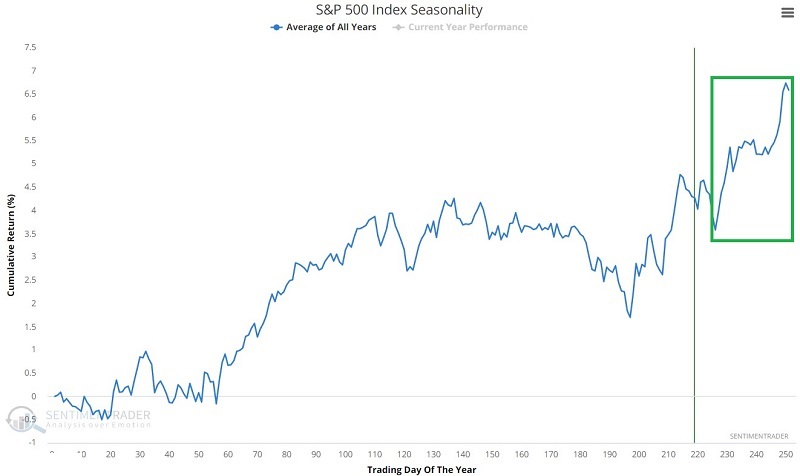
The chart below displays the annual seasonal trend for the S&P 500 Index. The year-end rally period extends from the close on Trading Day of the Year #226 through the end of the year. For 2022, this period extends from the close on 2022-11-23 through 2022-12-30.
Note that another version of the year-end rally begins on the Friday before Thanksgiving.
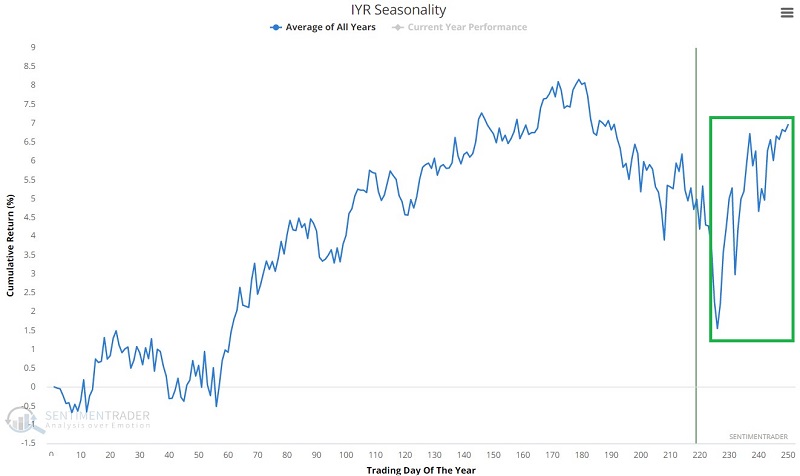
The chart below displays the annual seasonal trend for iShares U.S. Real Estate ETF (ticker IYR). Note that this sector tends to experience severe weakness leading up to TDY #226 and a sharp rebound toward the end of the year. Historically it has been by far the best-performing sector during this year-end period.
Testing favorable period results
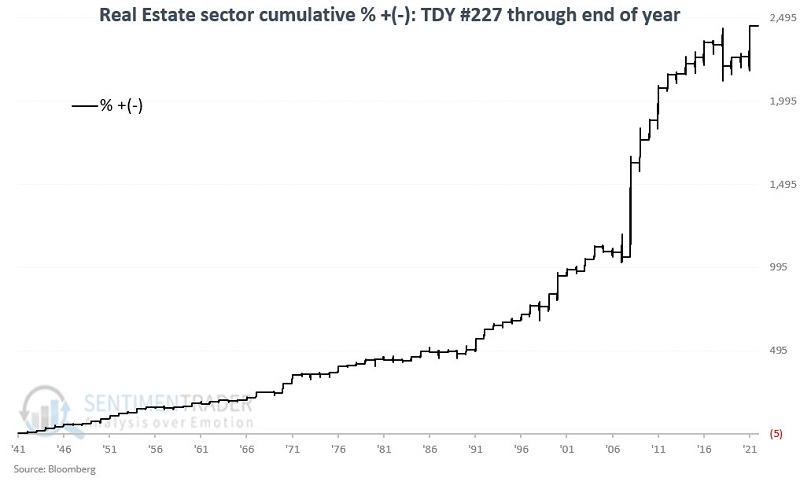
For our test, we use the Fama French database from 1941 to 1991 and the S&P 500 Real Estate sector index to the present. The strategy involves holding the real estate sector from the close on TDY #226 to the close on the year's last trading day. The chart below displays the hypothetical cumulative percentage return from doing so, and the table summarizes yearly performance.
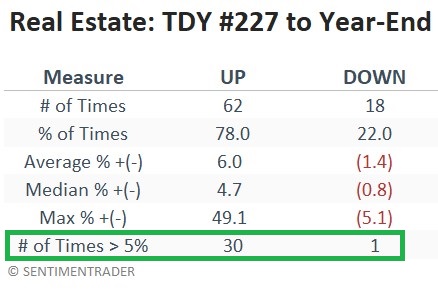
Even when real estate has declined during the favorable year-end period, the results have been less than catastrophic. To wit:
- The worst full-period loss was -5.14% in 2018
- The second worst performance was a loss of just -2.65% in 1964
- The median loss was a mere -0.81%
It is probably a good time to invoke the critical warning that seasonal trends have no guarantees. Despite the minimal nature of real estate sector losses during the year-end period in the past, a trader should still determine when to cut a loss if real estate declines during this purportedly favorable period in 2022.
On the flip side, while there was one loss over -5%, there have been 30 times when the gain for real estate during the year-end rally period exceeded +5%. This demonstrates a relatively remarkable degree of upside consistency.
Real Estate versus other sectors in the year-end window
The chart below displays the cumulative gain for 11 S&P 500 sectors during the year-end period since 1941. Year-to-year gains and losses for all sectors can vary dramatically. But the one thing that stands out in this chart is the magnitude of real estate's outperformance over the long term.
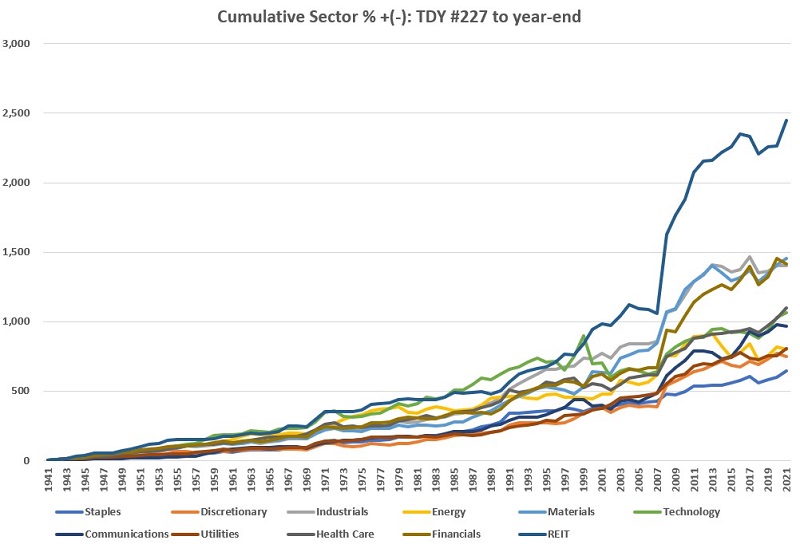
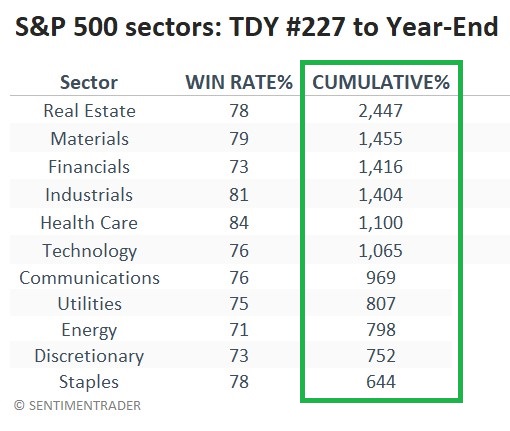
The table below displays each sector's Win Rate % and cumulative % + (-). During this year-end window, the real estate sector has gained 1.68 times that of the second-best-performing sector (Materials) and 3.80 times that of the least-performing sector (Consumer Staples).
What the research tells us…
There are two realities to consider here. First, the effects of rising interest rates and a weakening economy hang heavy over the real estate sector. Second, there is never the slightest guarantee that a given seasonal trend will play out as expected the next time. With those caveats in mind, for traders willing to assume those risks, it's hard to think of a more contrarian play with better historical odds than the real estate sector moving into year-end.