Data &
Technology
Research
Reports
Report Solutions
Reports Library
Actionable
Strategies
Free
Resources
Simple Backtest Calculator
Simple Seasonality Calculator
The Kelly Criterion Calculator
Sentiment Geo Map
Public Research Reports
Free Webinar
Pricing
Company
About
Meet Our Team
In the News
Testimonials
Client Success Stories
Contact
Log inLoginSign up
< BACK TO ALL REPORTS

It looks like investors are becoming euphoric

Jason Goepfert
2020-06-02
The Citigroup Panic / Euphoria Model shows that investors are disturbingly confident. Some of its component indicators don't agree.

Every once in a while, an indicator or model catches the investing public's attention. Reasons vary, but the gist of it is that we all want to find the holy grail, a simple and perfect guide that tells us what to do.

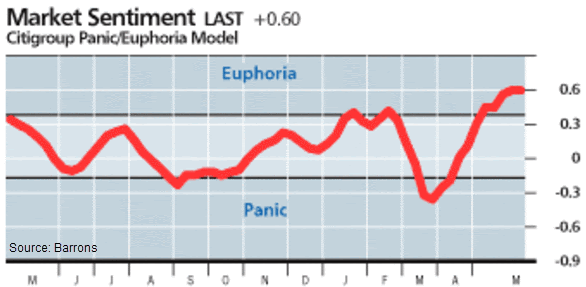
The indicator du jour is the Citigroup Panic / Euphoria Model published weekly in Barron's. It did a very good job of indicating euphoria in January and February, suggesting sentiment was overdone and stocks were due for below-average returns going forward. It flipped to panic in late March, another good call. Now it's back to euphoria, even more than at the beginning of the year.

When an indicator puts a couple of good signals together, it often gets praise as the "new thing." Once it inevitably fails, people move on to the next one. This particular model has been around for a long time, as have its detractors.

Based on publicly released data, the model's inputs are somewhat unusual. We've looked at all of them at some point, and few of them have any consistent record at being a contrary (or other) indicator of future stock returns. If we create a proxy model using the same inputs, it's currently a mixed bag, which means that the overall average is almost exactly zero, not showing any particular sense of panic or euphoria. It's unclear why the "official" model from Citigroup is showing euphoria.

Based on the published model, we should be concerned because it's showing that investors are euphoric about the potential for a further rally. It did a very good job of warning us early this year, which is a mark in its favor. While its recent record is very good, historically the model has been inconsistent after registering euphoric readings, and many components of the model don't agree. 


This is an abridged version of our recent reports and notes. For immediate access with no obligation, sign up for a 30-day free trial now.

We also looked at:

  • An in-depth look at Panic / Euphoria component indicators and a proxy model over the past 20 years
  • SPY hit a 50-day high on a 50-day low in volume
  • Silver has skyrocketed over the past 50 days
  • The ratio of gold to silver has plunged nearly 25%
  • High-yield (junk) bonds now have an overbought RSI
DATA &
TECHnologies
IndicatorEdge
‍
BackTestEdge
‍
Other Tools
‍
DataEdge API
RESEARCH
reports
Research Solution
‍
Reports Library
‍
actionable
Strategies
Trading Strategies
‍
Smart Stock Scanner
‍
FREE
RESOUrCES
Simple Backtest
Calculator
Simple Seasonality
Calculator
The Kelly Criterion
Calculator
Sentiment Geo Map
‍
Public Research Reports
‍
Free Webinar
COMPANY
‍
About
‍
Meet our Team
‍
In the News
‍
Testimonials
‍
Client Success Stories
Pricing
Bundle pricing
‍
Announcements
‍
FAQ
© 2024 Sundial Capital Research Inc. All rights reserved.
Setsail Marketing
TermsPrivacyAffiliate Program
Risk Disclosure: Futures and forex trading contains substantial risk and is not for every investor. An investor could potentially lose all or more than the initial investment. Risk capital is money that can be lost without jeopardizing ones’ financial security or life style. Only risk capital should be used for trading and only those with sufficient risk capital should consider trading. Past performance is not necessarily indicative of future results.

Hypothetical Performance Disclosure: Hypothetical performance results have many inherent limitations, some of which are described below. No representation is being made that any account will or is likely to achieve profits or losses similar to those shown; in fact, there are frequently sharp differences between hypothetical performance results and the actual results subsequently achieved by any particular trading program. One of the limitations of hypothetical performance results is that they are generally prepared with the benefit of hindsight. In addition, hypothetical trading does not involve financial risk, and no hypothetical trading record can completely account for the impact of financial risk of actual trading. for example, the ability to withstand losses or to adhere to a particular trading program in spite of trading losses are material points which can also adversely affect actual trading results. There are numerous other factors related to the markets in general or to the implementation of any specific trading program which cannot be fully accounted for in the preparation of hypothetical performance results and all which can adversely affect trading results.

Testimonial Disclosure: Testimonials appearing on this website may not be representative of other clients or customers and is not a guarantee of future performance or success.