
IS the SPX Golden Cross bullish for stocks?

Key points
- A "Golden Cross" in the stock market occurs when the 50-day average for the S&P 500 crosses above the 200-day average for that index
- The latest signal occurred at the close on 2025-07-01
- Below we detail the history of S&P 500 performance following previous signals
What is a Golden Cross?
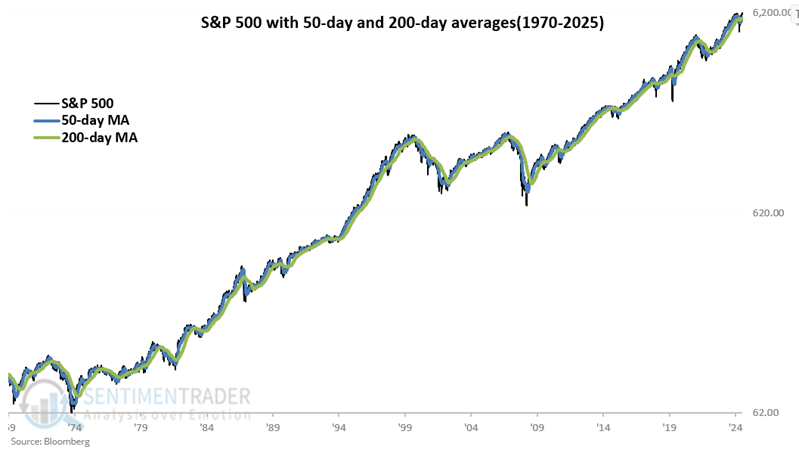
A new Golden Cross "buy" signal occurred at the close on 2025-07-01. A "Golden Cross" in the stock market occurs when the 50-day average for the S&P 500 crosses above the 200-day average for that index. The chart displays the S&P 500 Index since 1970 with the 50-day average in blue and the 200-day average in green. A Golden Cross "buy" signal occurs when the blue line crosses above the green line, and a Golden Cross "sell" signal occurs when the blue line crosses below the green line.
S&P 500 tends to show strength in the nine months following a signal
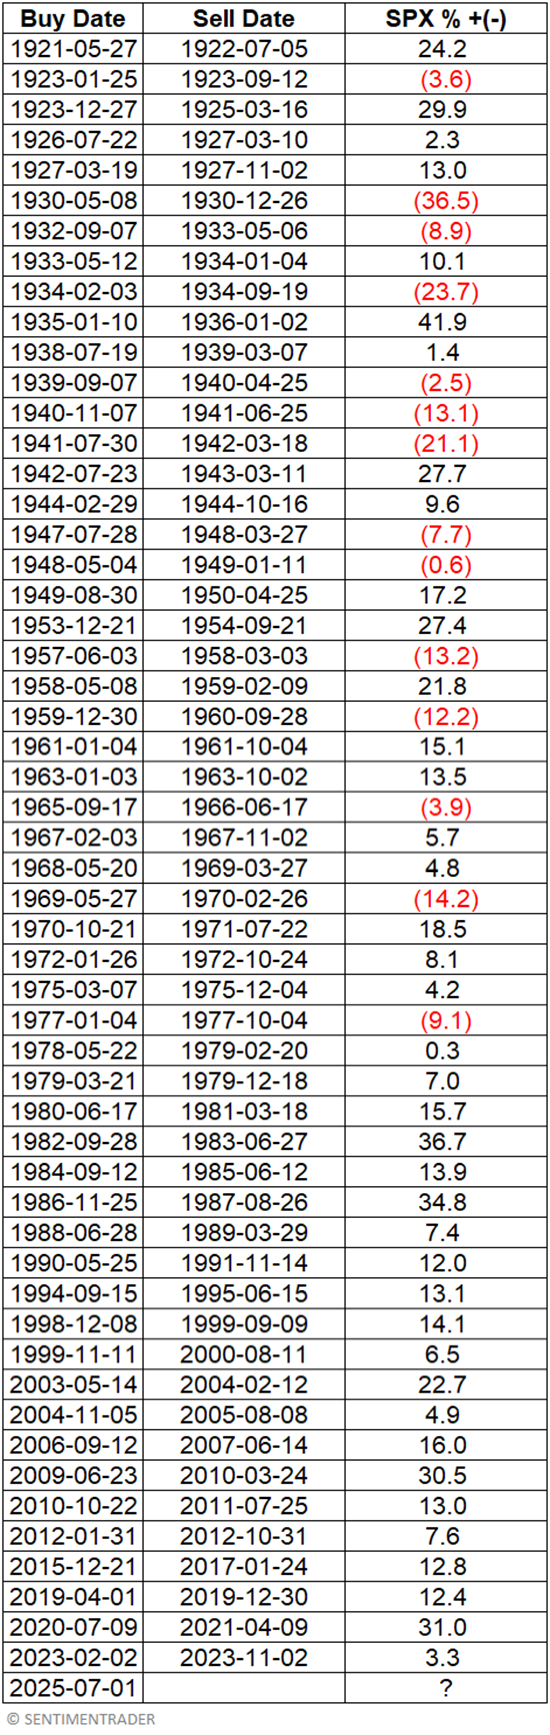
The table below shows the dates since 1920, when the 50-day average for the S&P 500 crossed above the 200-day moving average. It also displays the price performance for the S&P 500 over the next 189 trading days (i.e., nine months).
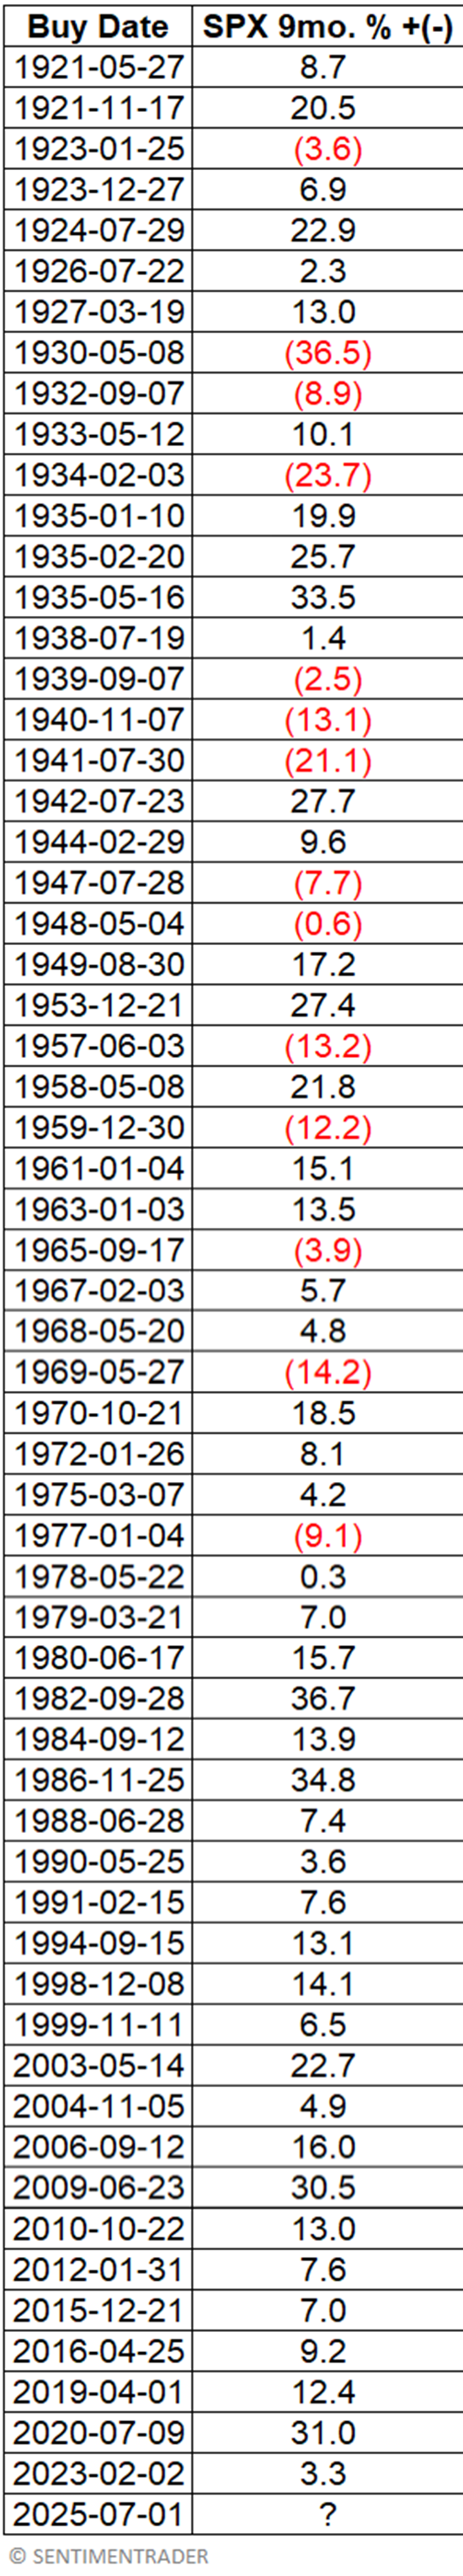
Note that since 1978, the last 23 signals have seen the S&P 500 show a nine-month gain after a signal. From 1920 through 1977, results were more mixed (23 wins versus 14 losses).
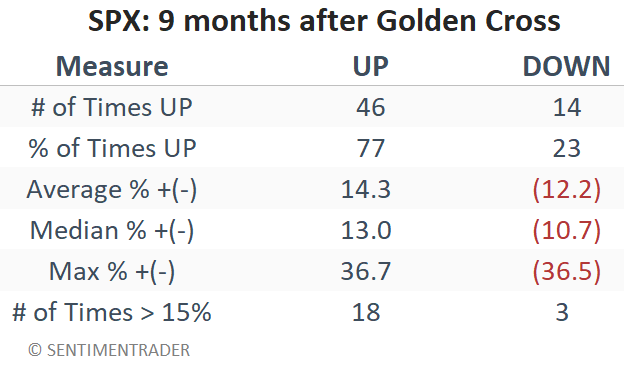
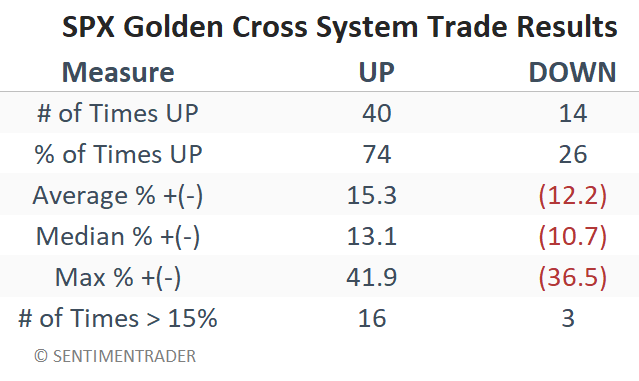
The table below summarizes the S&P 500's 9-month performance.
Now let's consider a more "systematic" approach.
A more systematic approach to the Golden Cross
We will use the following "rules:"
- If the 50-day average for the S&P 500 crosses above the 200-day moving average, we will buy the S&P 500 Index and set a counter to 189 days
- Each day, we subtract one from the counter
- If the 50-day average drops below the 200-day average AND THEN moves back above the 200-day average BEFORE the counter reaches 0, we will reset the counter to 189 days and continue to hold the S&P 500 Index for another 189 days
- We will sell the S&P 500 Index (and hold a flat position) when the counter reaches 0
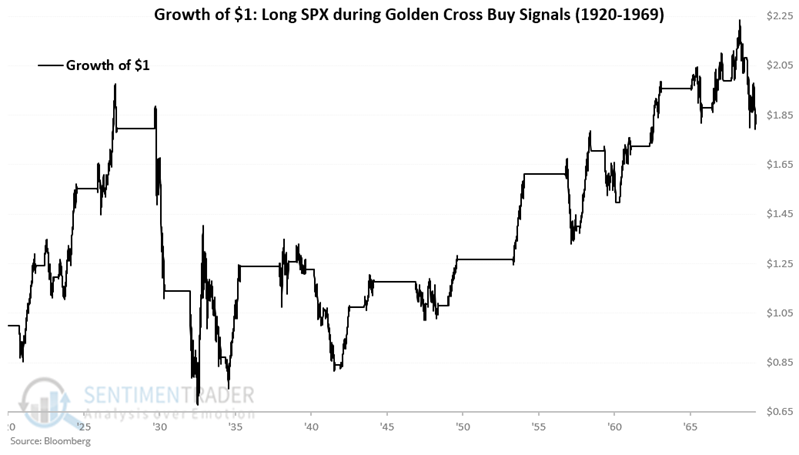
The chart below displays the hypothetical growth of $1 invested in the S&P 500 Index using the rules above from 1920 through 1969.
The chart below displays the hypothetical growth of $1 invested in the S&P 500 Index using the rules above from 1970 through 2025.
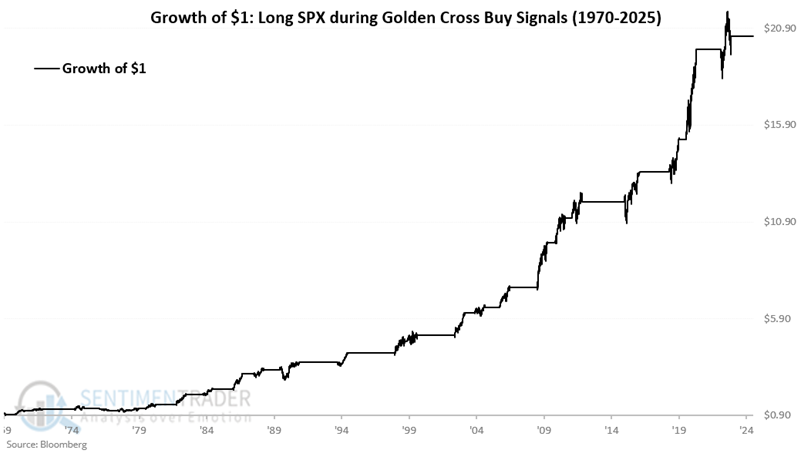
Note that results have been much more consistent in the last 50+ years than they were previously.
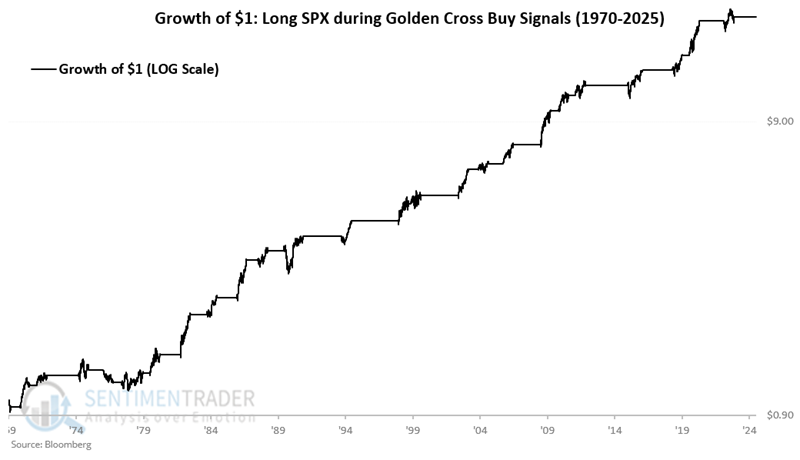
The chart below displays the hypothetical growth of $1 invested in the S&P 500 Index using the rules above from 1970 through 2025 on a logarithmic scale.
The table below displays the hypothetical "trades."
The table below summarizes results for this "system."
What the research tells us…
There is nothing "magic" about a "Golden Cross." In essence, it is simply one arbitrarily chosen moving average compared to another arbitrarily selected moving average. That said, the results in the last 50+ years are compelling, and give us reason to believe that the most recent Golden Cross on 2025-07-01 could lend weight to the favorable side of the weight of the evidence ledger.