Data &
Technology
Research
Reports
Report Solutions
Reports Library
Actionable
Strategies
Free
Resources
Simple Backtest Calculator
Simple Seasonality Calculator
The Kelly Criterion Calculator
Sentiment Geo Map
Public Research Reports
Free Webinar
Pricing
Company
About
Meet Our Team
In the News
Testimonials
Client Success Stories
Contact
Log inLoginSign up
< BACK TO ALL REPORTS

Is The Crash in the Lumber to Gold Ratio a Good Sell Signal?

Jason Goepfert
2021-06-16
The ratio of lumber to gold has crashed over the past month. It has sometimes signaled trouble for the stock market but it's a better indicator for lumber.

The ratio of lumber to gold is crashing, and it's raising concerns among some investors.

Lumber is considered a proxy for economic growth since it's an input to many construction projects. Gold is considered a "safe haven" asset that investors flock to in times of duress. Both assertions are questionable, but when the ratio of lumber to gold is rising, the theory is that investors are focused more on growth than safety, and it's a risk-on environment. 

Ever since the Optimism Index on lumber hit 90%, lumber has been in a free-fall, surpassing the last couple of post-euphoria crashes in speed, if not magnitude.

The last time the ratio crash, it preceded trouble in the S&P.

Crash in lumber to gold ratio

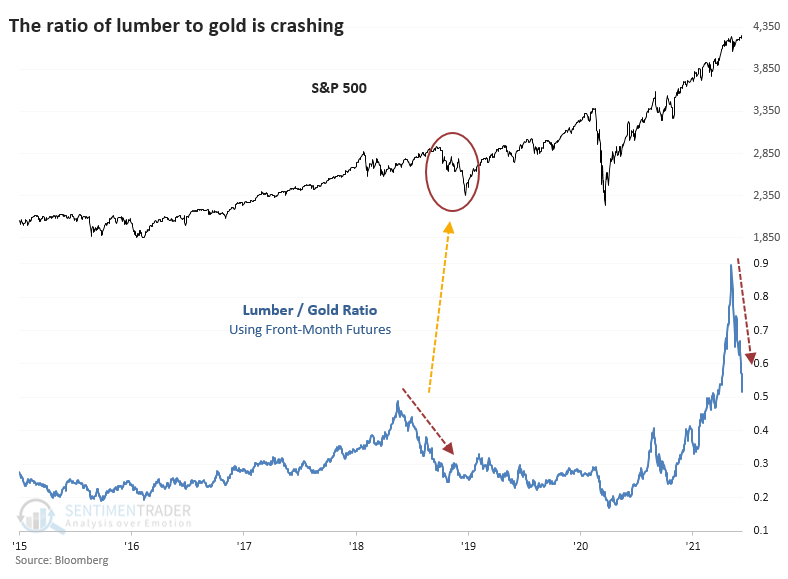
The trouble with charts is their subjectivity. So, we went back to the inception of the futures market for both contracts and looked at every time when the lumber / gold ratio cycled from a 3-year high to a 50-day low. On average, it took 29 days for the ratio to cycle like this, which is quick. 

It was not a good reason to sell stocks. The S&P 500 did crack a couple of times, including the one noted above. It preceded the 1990 recession scare and kinda-sorta the popping of the 2000 bubble. It was, however, a pretty good reason to sell lumber. 

What else we're looking at

  • Full returns in the S&P 500, lumber, and gold following a cycle in the lumber / gold ratio
  • What happened to the ratio between lumber and gold after these signals
  • How a crash in the ratio impacted homebuilding stocks, as well as major sectors and factors
  • Our Composite Breadth Rank for the S&P 500 is sliding
  • A close look at cotton and its outlook
  • There has been a spike of financial stocks falling to one-month lows - what it means going forward


Stat box

An average of more than $150 million per day has flowed into the TLT bond fund over the past two weeks. Our Backtest Engine shows that after similar inflows, TLT rose over the next two weeks only 28% of the time.

Etcetera

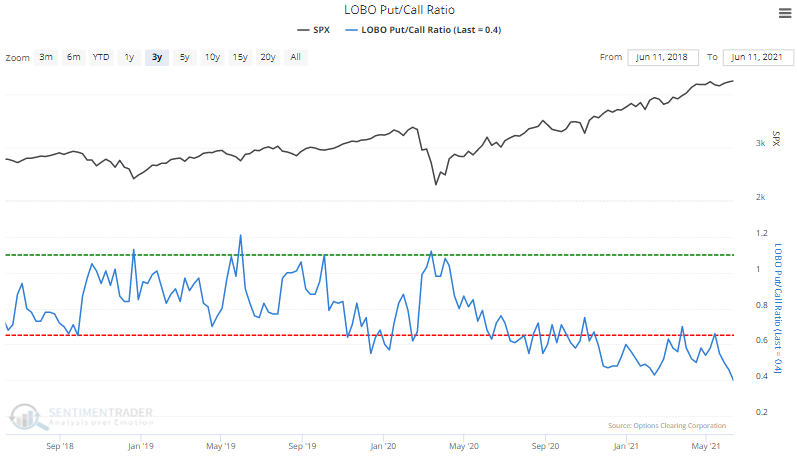
Calling all bears. The LOBO Put/Call Ratio has hit its lowest point since March of 2000, falling to 0.4. The term "LOBO" is an acronym for Large Open Buys Only and represents the volume of put options bought to open by the largest of traders versus the volume call options bought to open. The fact that it is the lowest in 20 years shows that even the largest traders have no interest in hedging.

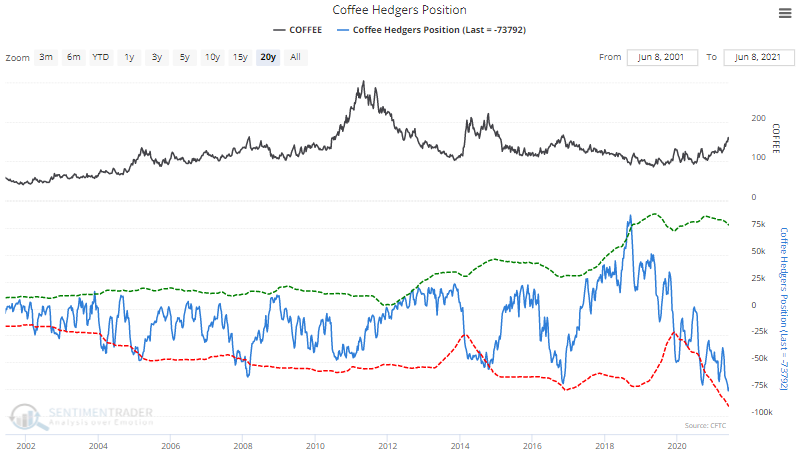
Caffeine buzz. With around 75,000 contracts net short, "smart money" commercial hedgers in coffee have been holding their largest exposure against the contract in history.

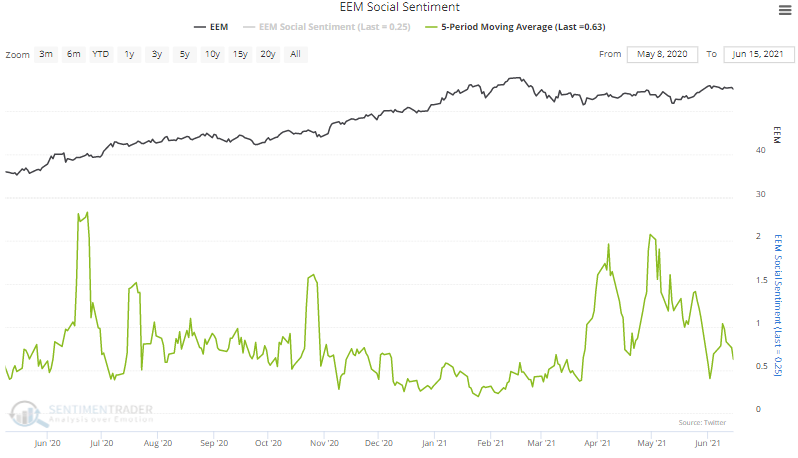
Feeling social. Twitter users are becoming more bullish on emerging markets. Our Social Sentiment score, which functions like a put/call ratio, showed more than two negative tweets about the EEM fund for every positive one in early May. That has since switched, with about twice as many positive as negative tweets in recent days.

DATA &
TECHnologies
IndicatorEdge
‍
BackTestEdge
‍
Other Tools
‍
DataEdge API
RESEARCH
reports
Research Solution
‍
Reports Library
‍
actionable
Strategies
Trading Strategies
‍
Smart Stock Scanner
‍
FREE
RESOUrCES
Simple Backtest
Calculator
Simple Seasonality
Calculator
The Kelly Criterion
Calculator
Sentiment Geo Map
‍
Public Research Reports
‍
Free Webinar
COMPANY
‍
About
‍
Meet our Team
‍
In the News
‍
Testimonials
‍
Client Success Stories
Pricing
Bundle pricing
‍
Announcements
‍
FAQ
© 2024 Sundial Capital Research Inc. All rights reserved.
Setsail Marketing
TermsPrivacyAffiliate Program
Risk Disclosure: Futures and forex trading contains substantial risk and is not for every investor. An investor could potentially lose all or more than the initial investment. Risk capital is money that can be lost without jeopardizing ones’ financial security or life style. Only risk capital should be used for trading and only those with sufficient risk capital should consider trading. Past performance is not necessarily indicative of future results.

Hypothetical Performance Disclosure: Hypothetical performance results have many inherent limitations, some of which are described below. No representation is being made that any account will or is likely to achieve profits or losses similar to those shown; in fact, there are frequently sharp differences between hypothetical performance results and the actual results subsequently achieved by any particular trading program. One of the limitations of hypothetical performance results is that they are generally prepared with the benefit of hindsight. In addition, hypothetical trading does not involve financial risk, and no hypothetical trading record can completely account for the impact of financial risk of actual trading. for example, the ability to withstand losses or to adhere to a particular trading program in spite of trading losses are material points which can also adversely affect actual trading results. There are numerous other factors related to the markets in general or to the implementation of any specific trading program which cannot be fully accounted for in the preparation of hypothetical performance results and all which can adversely affect trading results.

Testimonial Disclosure: Testimonials appearing on this website may not be representative of other clients or customers and is not a guarantee of future performance or success.