Data &
Technology
Research
Reports
Report Solutions
Reports Library
Actionable
Strategies
Free
Resources
Simple Backtest Calculator
Simple Seasonality Calculator
The Kelly Criterion Calculator
Sentiment Geo Map
Public Research Reports
Free Webinar
Pricing
Company
About
Meet Our Team
In the News
Testimonials
Client Success Stories
Contact
Log inLoginSign up
< BACK TO ALL REPORTS

Investors Are Leaving As Black Swan Risk Rises

Jason Goepfert
2019-12-10
null

Equity fund flows are negative, and options SKEW is rising.

Leaving early

Investors have pulled hundreds of billions from equity funds in 2019, despite large gains in the funds. Because the gains have been so large, the outflows are small as a percentage of total assets.

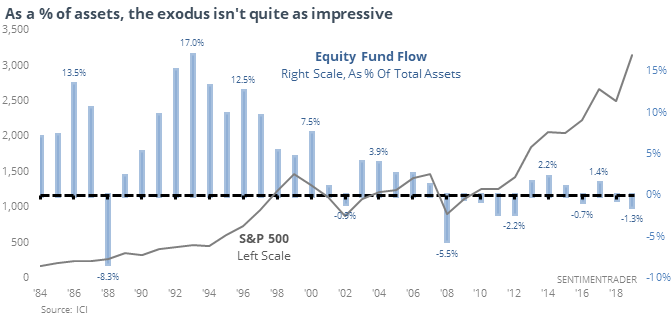
Still, it’s an outflow, and stocks have a good record of rallying after any year that saw a net outflow from equity funds, with no losses a year after the other 9 years that saw outflows. It was even more unusual to see outflows during a year when the S&P 500 showed a decent positive return, and the next year tended to be even more positive (though the sample size is very small).

It might seem ironic that investors are pulling money out of funds during a year when stocks are rising, but there is actually a higher correlation to fund flows and the prior year's return in stocks. Perhaps it's a residual effect of investors opening year-end statements. If that's the case, then we should see inflows resume in 2020.


SKEWed Perspective

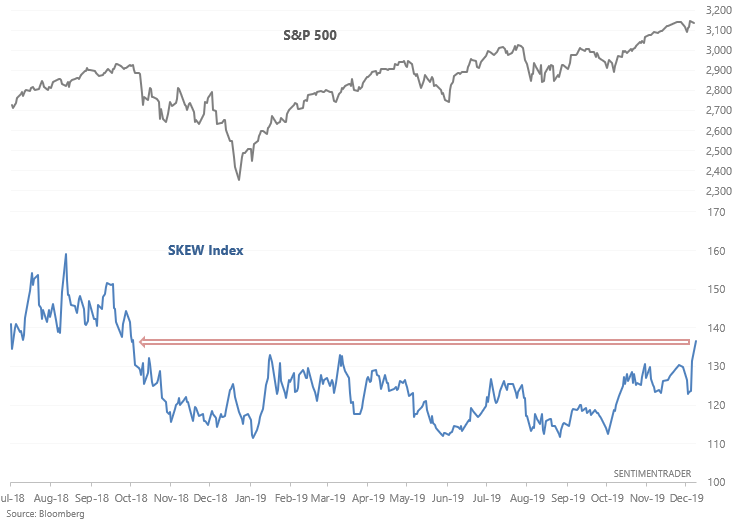
Last week in a report, we saw that while options traders were pricing in relatively calm short-term conditions, they were bidding up the price of put protection a year out (likely due to uncertainty regarding the election).

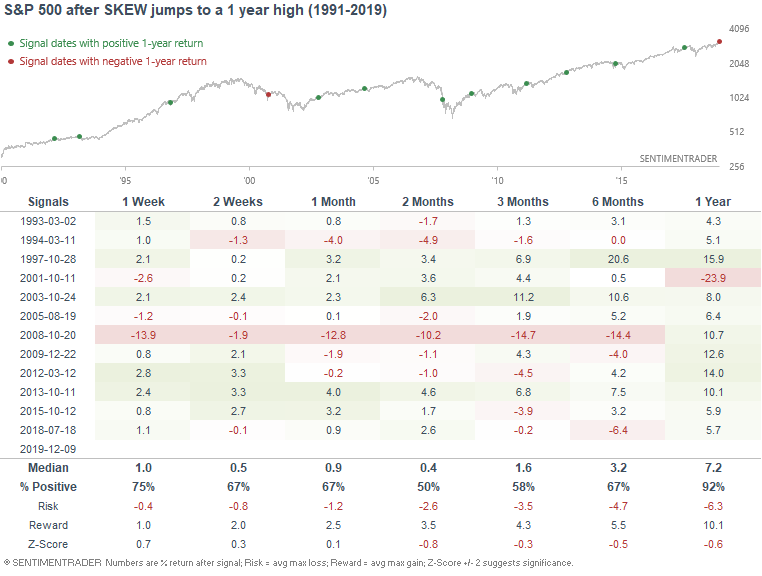
Due in part to this activity, the SKEW Index, which looks at the risk of a black swan event in equities over the next 30 days, jumped to the highest level since October 2018.

When this happened in the past, the S&P's returns over the next 2 months were worse than random, suggesting that it was better to hold bonds than stocks. In addition, returns over the next year were mostly bullish, with the exception of October 2001. That bearish case occurred in different environment from today: stocks were in a clear downtrend, and the economy was in a recession.

While this led to mixed results in stocks over the next 2-3 months, it wasn't a particularly bullish signal for VIX. If anything, VIX's returns over the next few weeks and months were more bearish than random.

This is an abridged version of our recent reports and notes. For immediate access with no obligation, sign up for a 30-day free trial now.

We also looked at:

  • Wall Street strategists aren't very optimistic about 2020
  • What happens after gold has a good year like 2019
  • Copper's breakout and what that means for emerging markets
  • Optimism on the British pound is high
  • Palm oil has surged
DATA &
TECHnologies
IndicatorEdge
‍
BackTestEdge
‍
Other Tools
‍
DataEdge API
RESEARCH
reports
Research Solution
‍
Reports Library
‍
actionable
Strategies
Trading Strategies
‍
Smart Stock Scanner
‍
FREE
RESOUrCES
Simple Backtest
Calculator
Simple Seasonality
Calculator
The Kelly Criterion
Calculator
Sentiment Geo Map
‍
Public Research Reports
‍
Free Webinar
COMPANY
‍
About
‍
Meet our Team
‍
In the News
‍
Testimonials
‍
Client Success Stories
Pricing
Bundle pricing
‍
Announcements
‍
FAQ
© 2024 Sundial Capital Research Inc. All rights reserved.
Setsail Marketing
TermsPrivacyAffiliate Program
Risk Disclosure: Futures and forex trading contains substantial risk and is not for every investor. An investor could potentially lose all or more than the initial investment. Risk capital is money that can be lost without jeopardizing ones’ financial security or life style. Only risk capital should be used for trading and only those with sufficient risk capital should consider trading. Past performance is not necessarily indicative of future results.

Hypothetical Performance Disclosure: Hypothetical performance results have many inherent limitations, some of which are described below. No representation is being made that any account will or is likely to achieve profits or losses similar to those shown; in fact, there are frequently sharp differences between hypothetical performance results and the actual results subsequently achieved by any particular trading program. One of the limitations of hypothetical performance results is that they are generally prepared with the benefit of hindsight. In addition, hypothetical trading does not involve financial risk, and no hypothetical trading record can completely account for the impact of financial risk of actual trading. for example, the ability to withstand losses or to adhere to a particular trading program in spite of trading losses are material points which can also adversely affect actual trading results. There are numerous other factors related to the markets in general or to the implementation of any specific trading program which cannot be fully accounted for in the preparation of hypothetical performance results and all which can adversely affect trading results.

Testimonial Disclosure: Testimonials appearing on this website may not be representative of other clients or customers and is not a guarantee of future performance or success.