Data &
Technology
Research
Reports
Report Solutions
Reports Library
Actionable
Strategies
Free
Resources
Simple Backtest Calculator
Simple Seasonality Calculator
The Kelly Criterion Calculator
Sentiment Geo Map
Public Research Reports
Free Webinar
Pricing
Company
About
Meet Our Team
In the News
Testimonials
Client Success Stories
Contact
Log inLoginSign up
< BACK TO ALL REPORTS

Investor And Advisor Optimism Is The Highest In Years

Jason Goepfert
2019-12-31
Investor and advisor optimism has spiked, as the yield curve goes from inversion to the steepest in a year.

Investor and advisor optimism has spiked, as the yield curve goes from inversion to the steepest in a year.

AIM (Advisor & Investor Model)

With the U.S. stock market trending higher into year-end, more and more market investors are turning optimistic towards U.S. equities. This stands in stark contrast with the end of 2018, when the common question wasn't if a recession was about to start, but when it will start.

Our Advisor and Investor Model, which looks at sentiment readings from advisor and investor surveys, has risen to the highest level in almost 3 years:

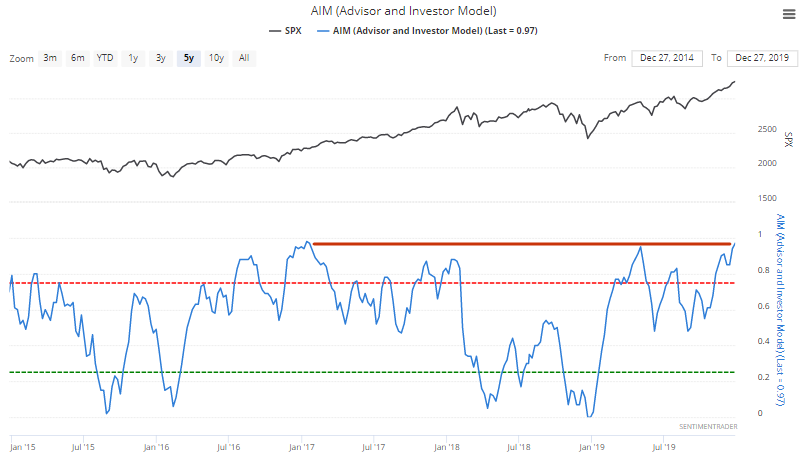
While extremely high sentiment readings are often short term bearish for stocks, they aren't usually bearish on a 6-12 month basis. A resurgence in excessive optimism tends to happen 1-2 years after a major period of market turmoil. It usually takes some time for investors and traders to mentally shake off the ghosts of the past.

AIM rising to an almost 3 year high occurred in:

  1. 1989 (after the 1987 crash). Stocks continued to rally over the next year
  2. 1995 (after a yearlong consolidation in 1994). Stocks continued to rally over the next year
  3. 2002 (after the 2001 recession). This was a false rally, and the bear market went down 1 more leg
  4. 2009 (after the 2008/09 recession and stock market crash). Stocks continued to rally over the next year
  5. 2016 (after the 2015-2016 global slowdown scare). Stocks continued to rally over the next year


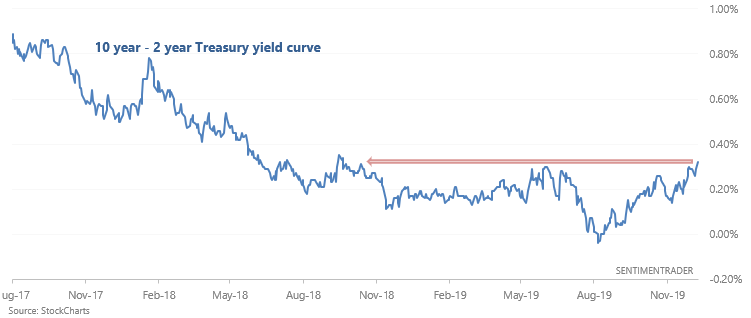
Yield curve steepening

Investors were freaking out over the yield curve inversion this year due to the signal's historical ability to predict recessions and bear markets. With long term yields no longer falling, the 10 year - 2 year Treasury yield curve has steepened to the highest level since 2018:

We can narrow down this list of dates to cases which saw an inverted yield curve sometime over the past year:

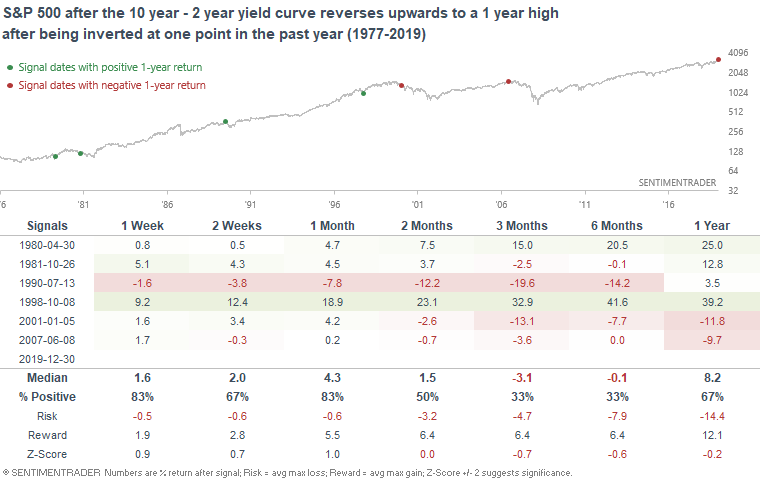
Overall, the yield curve is sending a long term bearish signal for stock market bulls. It will weigh on our Macro Index for January 2020, but will not be enough to flip it from bullish to bearish. It's important to remember that the yield curve is merely one of many fundamental indicators to watch, and is not the Holy Grail of timing bear markets or recessions.

This is an abridged version of our recent reports and notes. For immediate access with no obligation, sign up for a 30-day free trial now.

We also looked at:

  • More detail on the Macro Index and what it's saying now
  • Initial jobless claims are on the verge of trending higher
  • Emerging market currencies are overbought
DATA &
TECHnologies
IndicatorEdge
‍
BackTestEdge
‍
Other Tools
‍
DataEdge API
RESEARCH
reports
Research Solution
‍
Reports Library
‍
actionable
Strategies
Trading Strategies
‍
Smart Stock Scanner
‍
FREE
RESOUrCES
Simple Backtest
Calculator
Simple Seasonality
Calculator
The Kelly Criterion
Calculator
Sentiment Geo Map
‍
Public Research Reports
‍
Free Webinar
COMPANY
‍
About
‍
Meet our Team
‍
In the News
‍
Testimonials
‍
Client Success Stories
Pricing
Bundle pricing
‍
Announcements
‍
FAQ
© 2024 Sundial Capital Research Inc. All rights reserved.
Setsail Marketing
TermsPrivacyAffiliate Program
Risk Disclosure: Futures and forex trading contains substantial risk and is not for every investor. An investor could potentially lose all or more than the initial investment. Risk capital is money that can be lost without jeopardizing ones’ financial security or life style. Only risk capital should be used for trading and only those with sufficient risk capital should consider trading. Past performance is not necessarily indicative of future results.

Hypothetical Performance Disclosure: Hypothetical performance results have many inherent limitations, some of which are described below. No representation is being made that any account will or is likely to achieve profits or losses similar to those shown; in fact, there are frequently sharp differences between hypothetical performance results and the actual results subsequently achieved by any particular trading program. One of the limitations of hypothetical performance results is that they are generally prepared with the benefit of hindsight. In addition, hypothetical trading does not involve financial risk, and no hypothetical trading record can completely account for the impact of financial risk of actual trading. for example, the ability to withstand losses or to adhere to a particular trading program in spite of trading losses are material points which can also adversely affect actual trading results. There are numerous other factors related to the markets in general or to the implementation of any specific trading program which cannot be fully accounted for in the preparation of hypothetical performance results and all which can adversely affect trading results.

Testimonial Disclosure: Testimonials appearing on this website may not be representative of other clients or customers and is not a guarantee of future performance or success.