
Inverse ETF volume triggers a buy signal

Key points:
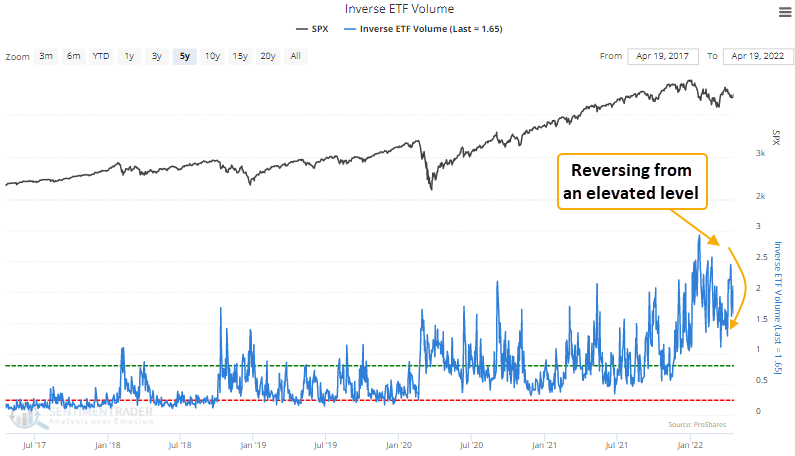
- Inverse ETF volume relative to NYSE composite volume surged to an elevated level
- The volume ratio has subsequently reversed, triggering a risk-on signal
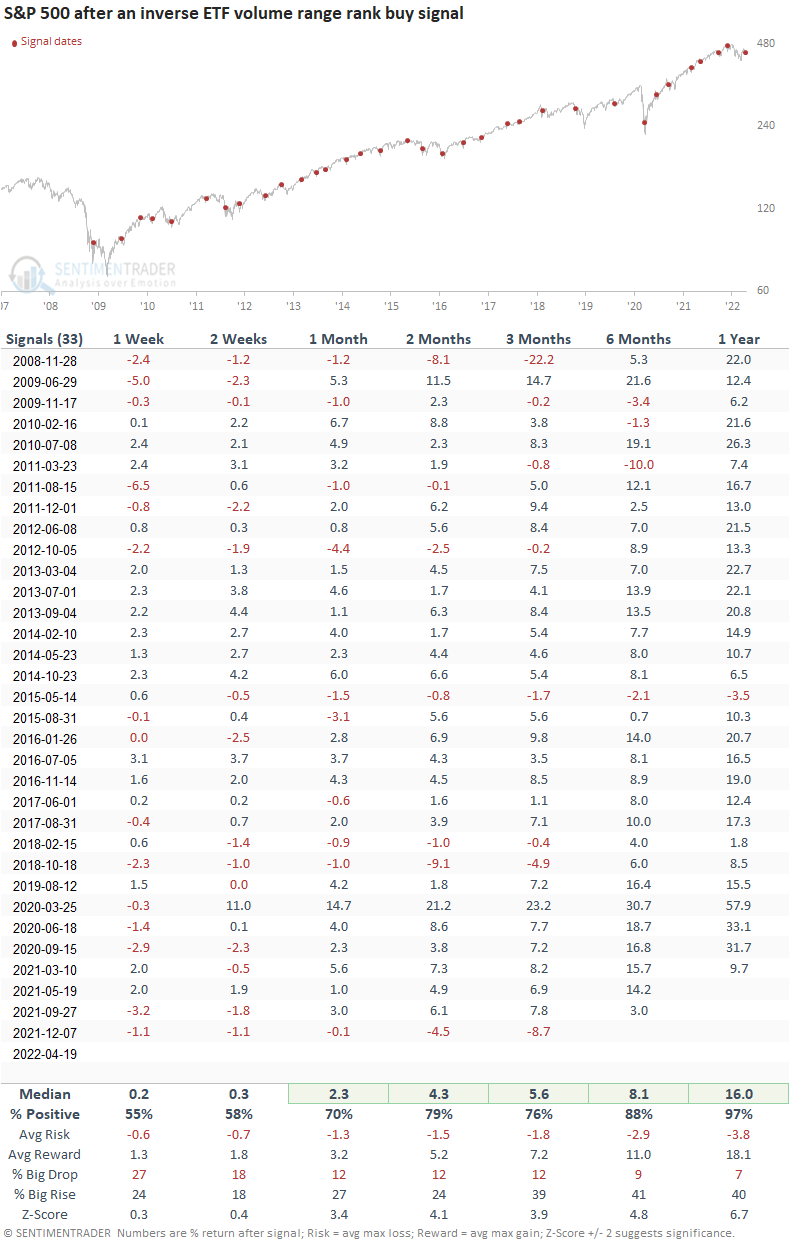
- The S&P 500 has rallied 79% of the time over the next 2 months after other signals
Stock market inverse ETF volume as a contrary sentiment indicator
Stock market inverse ETFs are a relatively new tool for expressing a short position in a particular index or sector. So, when inverse ETF volume surges relative to NYSE composite volume, investors or traders are concerned about the stock market and implement a hedge or speculative bet on a decline. The volume ratio between the two series can be a contrary indicator to identify an environment where sentiment has become too pessimistic. When emotion becomes too bearish, the stock market rallies.
A trading model that identifies a reversal in sentiment
Because the volume ratio has an upward bias to the data, we need to apply a derivative to the indicator to identify bullish and bearish threshold levels that shift through time. I'm a big fan of the range rank methodology. As a reminder, the range rank measures the current value of an indicator relative to all other values over a lookback period. 100 is the highest, and 0 is the lowest.
The inverse ETF volume trading model applies an 84-day range rank to the volume ratio indicator. A pessimistic reset condition is confirmed when the range rank indicator crosses above the 99th percentile. After the reset, a new buy signal occurs when the range rank crosses below the 47th percentile. Within 5 days of the cross, the 5-day rate of change for the S&P 500 must be >= 1%. i.e., market momentum is positive.
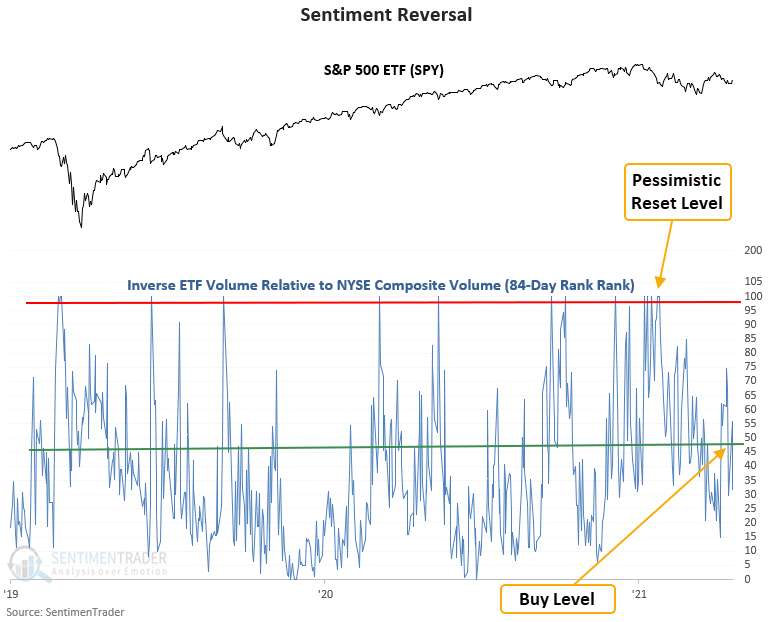
Important Point:
The new alert provides an excellent example of why I include a momentum condition with my trading signals. Since the pessimistic reset, the range rank crossed below the buy level threshold on several occasions. However, the momentum condition never turned true within the 5-day window. Therefore, a signal did not trigger until the most recent cross and momentum confirmation.
Similar reversals in volume-based sentiment have preceded gains 79% of the time
This model generated a signal 33 other times over the past 14 years. After the others, SPY's future returns and win rates were excellent across almost all time frames, especially the 2-month window. The inverse ETF volume data is a relatively new time series with a start date around 2008. So, I wouldn't read too much into the 1-year results. i.e., it's had the benefit of a massive bull market. Signal failures like 11/28/08, 10/18/2018, and 12/7/21 occurred during hostile environments. In the case of October 2018 and December 2021, you had an unfriendly Fed, which is still the case now.
What the research tells us...
When inverse ETF volume relative to NYSE volume surges, market participants have become too pessimistic about the outlook for the stock market. Stocks are likely to reverse higher when the pessimistic extreme recedes. Similar setups to what we're seeing now have preceded rising prices for the S&P 500, with a 2-month win rate of 79%. However, we need to keep in mind that buy-the-dip strategies like this one can struggle in an unfriendly market environment, which is the case now.