
Inverse ETF Volume suggests higher stock prices

Key points:
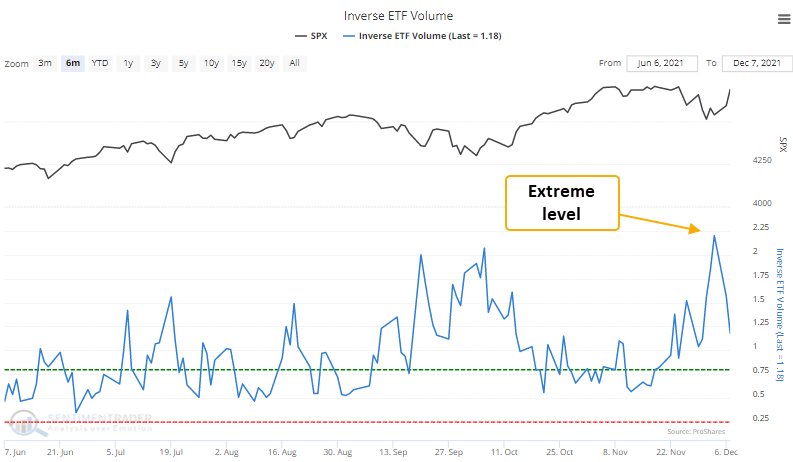
- Inverse ETF volume relative to NYSE composite volume surged to the highest level in history
- The volume ratio has subsequently declined, triggering a risk-on signal
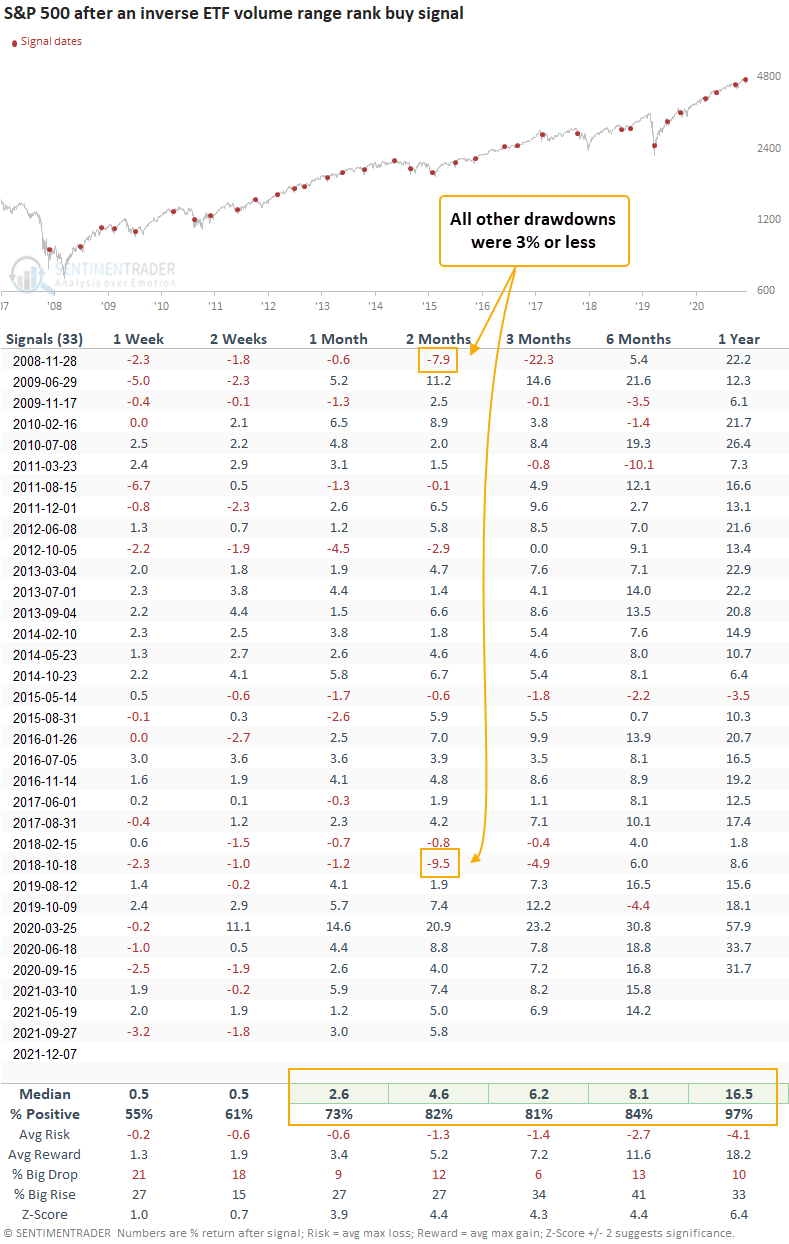
- The S&P 500 has rallied 82% of the time over the next 2 months after other signals
Stock market inverse ETF volume as a contrary sentiment indicator
Stock market inverse ETFs are a relatively new tool for expressing a short position in a particular index or sector. So, when inverse ETF volume surges relative to NYSE composite volume, investors or traders are concerned about the stock market and implement a hedge or speculative bet on a decline. The volume ratio between the two series can be a contrary indicator to identify an environment where sentiment has become too pessimistic. When sentiment becomes too bearish, the stock market rallies.
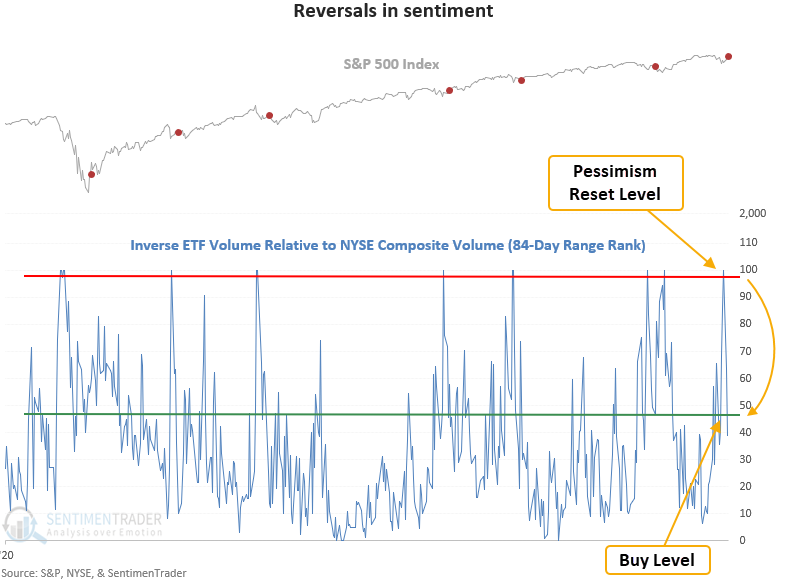
A trading model that identifies a reversal in sentiment
Because the volume ratio has an upward bias to the data, we need to apply a derivative to the indicator to identify a pessimistic threshold level that changes over time. I'm a big fan of the range rank methodology, as you know from previous notes. As a reminder, the range rank measures the current value of an indicator relative to all other values over a lookback period. 100 is the highest, and 0 is the lowest.
The inverse ETF volume trading model applies an 84-day lookback period to the volume ratio indicator to create the range rank indicator. The pessimistic reset condition is confirmed when the range rank indicator crosses above the 99th percentile. A new buy signal occurs when the range rank crosses back below the 47th percentile. At the same time, the 5-day rate of change for the S&P 500 must be >= 1%. i.e., market momentum is positive.
Because the volume ratio data is volatile, I use two reset conditions to identify the first signal in a drawdown phase. The first is when the range rank indicator crosses below the 20th percentile, and the other is a days-in-trade waiting period of 2 months.
Similar reversals in volume-based sentiment have preceded gains 82% of the time
This signal has triggered 33 other times over the past 12 years. After the others, future returns and win rates were excellent across almost all time frames, especially the 2-month window. The recent results in the 1-2 week time frame show that the signal has been early lately. The inverse ETF volume data is a relatively new time series with a start date around 2008. So, I wouldn't read too much into the 1-year results. i.e., it's had the benefit of a massive bull market.
What the research tells us...
When inverse ETF volume relative to NYSE volume surges, market participants have become too pessimistic on the outlook for the stock market. Stocks are likely to reverse higher when the pessimistic extreme recedes. Similar setups to what we're seeing now have preceded rising prices for the S&P 500, with a 2-month win rate of 82%.