Interesting Charts From The Outside


According to BofA, private clients have been heavy sellers. This has been a good non-contrary indicator over the past decade, with generally poor stock performance following heavy selling and rallies following heavy buying. Not good.
(Source: ZeroHedge)
They also show that Wall Street is still negative on stocks. We've discussed this indicator in the past and put very little weight on it. It is made up of only a handful of strategists' target allocations, and one particular strategist with a very low suggesting equity allocation can (and is) skewing this data lower. We would not consider this to be a factor at all.

(Source: ZeroHedge)
Clients of FXCM brokerage are heavily short the S&P 500. This index has a short history but provides a real-money look at how speculative traders are positioned. Curiously, it has been more of a non-contrary indicator, with large long positions corresponding well with price lows and vice-versa. The fact that clients are so short currently is a negative.
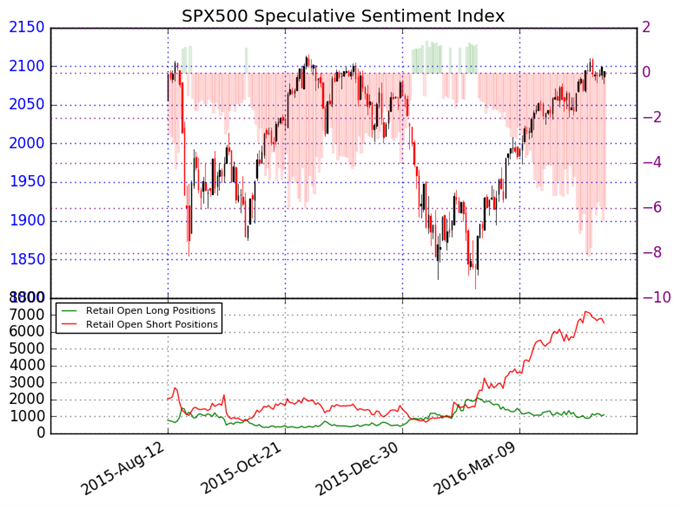
(Source: FXCM)
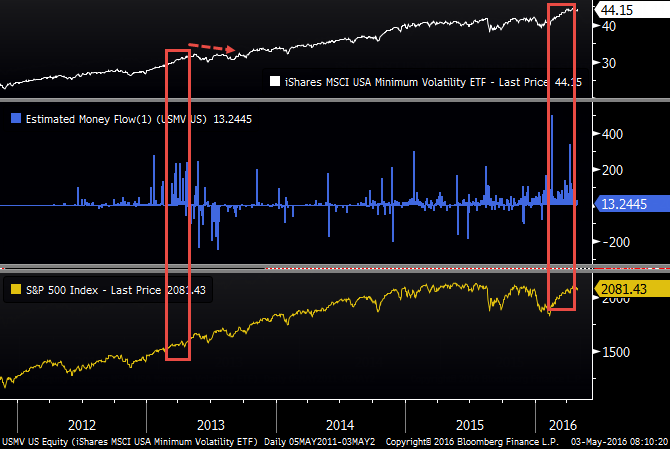
Nervousness among investors (or advisors) is also causing a persistent flow of money into minimum-volatility funds like USMV. The knee-jerk reaction is to assume that this nervousness on the part of investors is a good sign, but history for these funds is too short to form any conclusions. The only other time the fund had a large, persistent inflow was in the spring of 2013. After that point, the fund struggled even while stocks continued to rally and investors rotated into higher-volatility stocks. Not sure what to make of that.