
Interest rates and trend-following - part II

Key Points
- The interplay between large-cap and small-cap stocks have a strong correlation to fluctuations in interest rates
- A trend-following method using those factors was a consistent predictor for rates
Indicator #2: Small-cap index versus Large-cap index
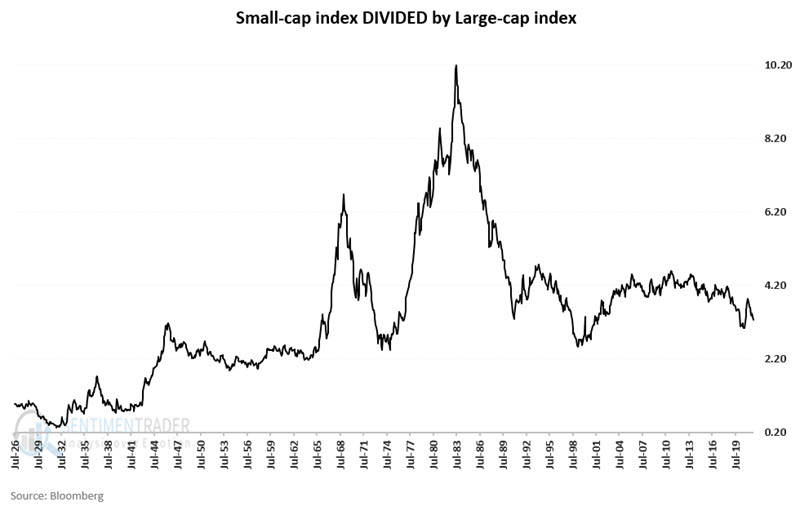
Small-cap stocks can be more sensitive to economic conditions. So, it makes some sense that when those stocks are outperforming, bond yields tend to rise.
For testing, we will use a small-cap index and a large-cap index starting in 1926. The small-cap index uses the Fama French dataset from 1926 to 1995 and then the Russell 2000 after that. The large-cap index uses the Fama French dataset from 1926 to 1989 and then the Russell 1000 after that.
The chart below shows the small-cap/large-cap ratio since 1926.
To identify the trend, I use a 2-month and a 7-month exponential moving average (EMA) of the small-cap/large-cap ratio at the end of each month. The difference between these two averages at the end of each month appears in the chart below.
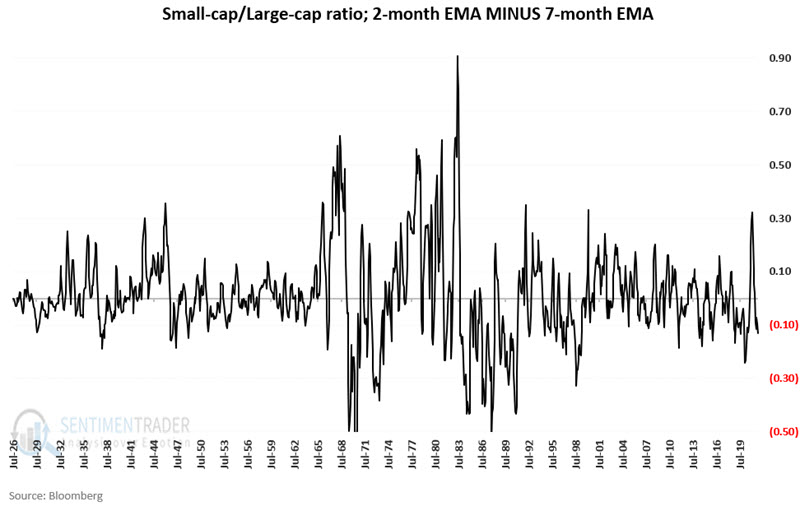
While the dataset in the chart above appears to be quite random, over time, it has a very high degree of correlation to changes in interest rates.
Using the ratio as a predictor for rates
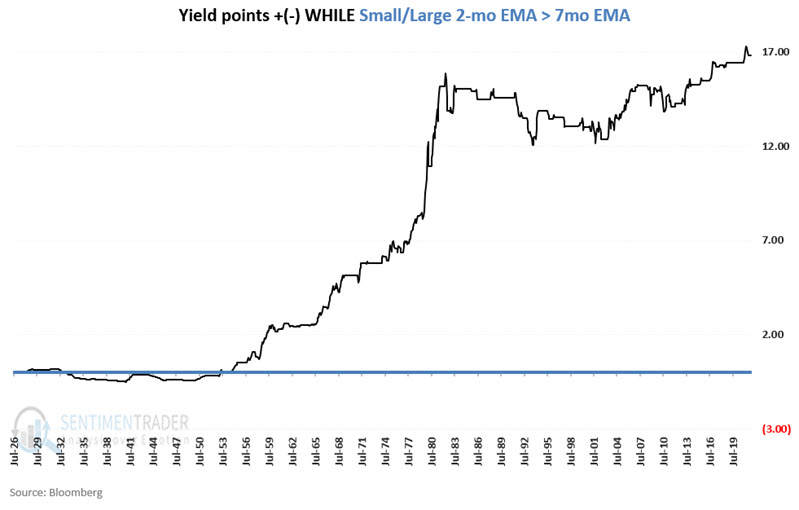
Our goal is to determine how well our indicator tracks the trend in interest rates, not necessarily the exact impact on bond prices. In measuring results, we will look solely at changes in bond yields. So, for example, if yields rise from 4% to 5%, we will note that as an increase of 1.00 yield points. Conversely, if yields fall from 8% to 7%, we will note that as a decrease of 1.00 yield points.
The chart below displays the cumulative gain/loss in yield points while the chart above is above 0. Meaning, when the 2-month EMA of the small-cap/large-cap ratio is above the 7-month EMA.
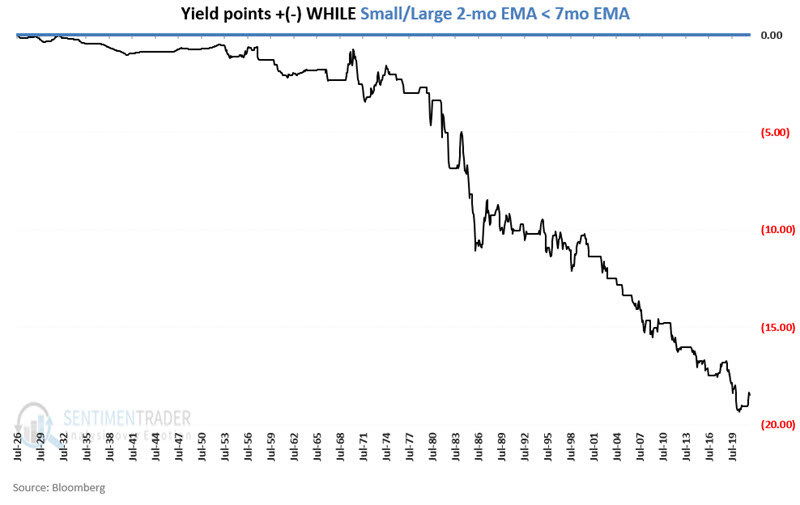
The chart below shows the cumulative gain/loss in yield points, while the chart above is below 0.
To measure the efficiency of this simple method for tracking interest rates, let's use the following methodology:
- Add changes in yield points if the small-cap/large-cap 2-month EMA is above the 7-month EMA
- Subtract changes in yield points if the small-cap/large-cap 2-month EMA is below the 7-month EMA
The chart below displays the cumulative yield points captured using this method since 1926.
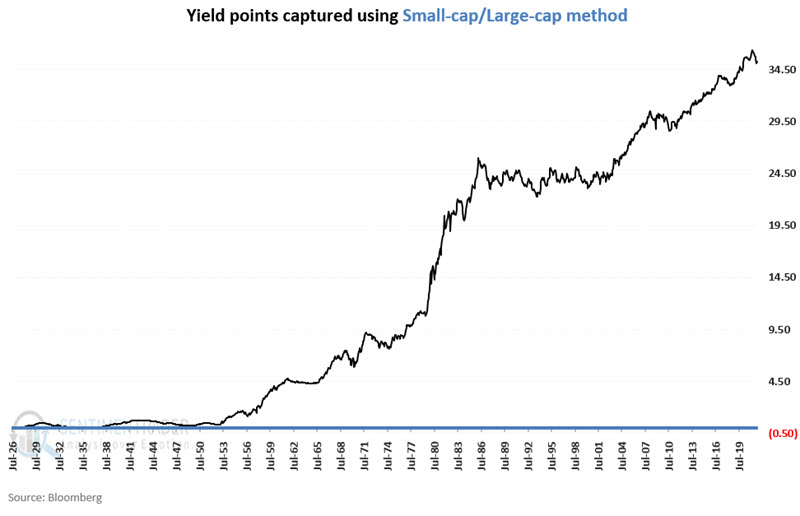
The chart shows the same information as the last chart, along with the cumulative net change for the 10-year treasury yield itself.

What the research tells us:
The ebb and flow between small-cap and large-cap stocks have demonstrated a high degree of correlation with the fluctuations of interest rates over the past 95 years. Tracking this relationship as described above can help an investor stay in tune with the primary interest rate trend and filter out a lot of the "noise" generated on the topic.
As of the end of November 2021, this monthly indicator was negative and thus suggesting lower interest rates.