Interest rate clues from Eurodollars
Key Points
- Eurodollars rise and fall inversely to short-term interest rates
- Eurodollar trader sentiment also appears to work inversely (bearish sentiment is bearish for Eurodollars and vice versa)
- Eurodollar Optix appears to offer valuable clues regarding short-term bonds…
- …and inverse clues regarding corporate bonds
What is a Eurodollar?
According to Investopedia: The term Eurodollar refers to U.S. dollar-denominated deposits at foreign banks or the overseas branches of American banks. Because they are held outside the United States, Eurodollars are not subject to regulation by the Federal Reserve Board, including reserve requirements. Dollar-denominated deposits not subject to U.S. banking regulations were originally held almost exclusively in Europe (hence, the name Eurodollar). They are also widely held in branches located in the Bahamas and the Cayman Islands.
Eurodollar futures are priced as 100 minus the current (short-term) interest rate. So, if the interest rate is 1.00%, then the price of a Eurodollar futures contract would be 99.00 (i.e., 100 - 1.00). Likewise, if the interest rate were 5.00%, the price would be 95.00 (i.e., 100 - 5.00).
Eurodollar Optix
Eurodollars are an anomaly in how they are priced. They also appear to be an anomaly regarding the implication of sentiment extremes. For most markets/indexes, a low Optix reading suggests too much bearishness on the part of traders and the potential for higher prices. With Eurodollars, it appears to be the opposite (for the record, "No," I can't explain it).
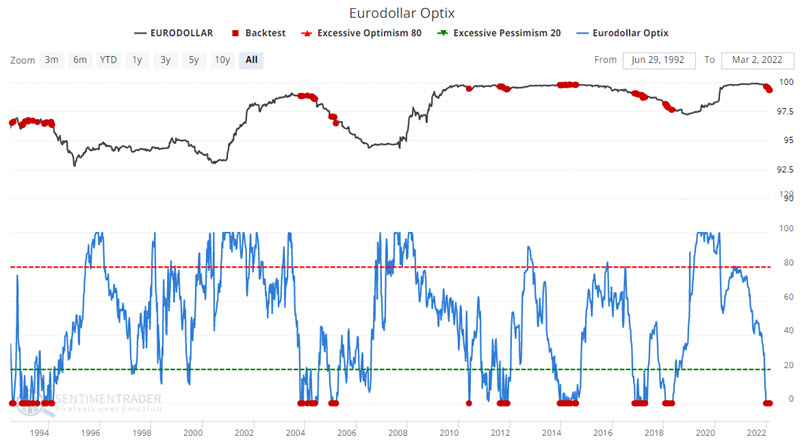
The chart below displays Eurodollar futures and all days when Eurodollar Optix hit a reading of 0. You can run this test in the Backtest Engine.

The table below displays a summary of the results.
In the table above, we see uniformly bearish results, with almost every period showing worse Average and Median returns and a lower Win Rate %. To spell this out: Eurodollar Optix readings of 0 have (so far) invariably been followed by a rise in short-term interest rates (i.e., lower Eurodollar prices).
It looks like this applies only to shorter-term securities.
Two-year and five-year treasuries
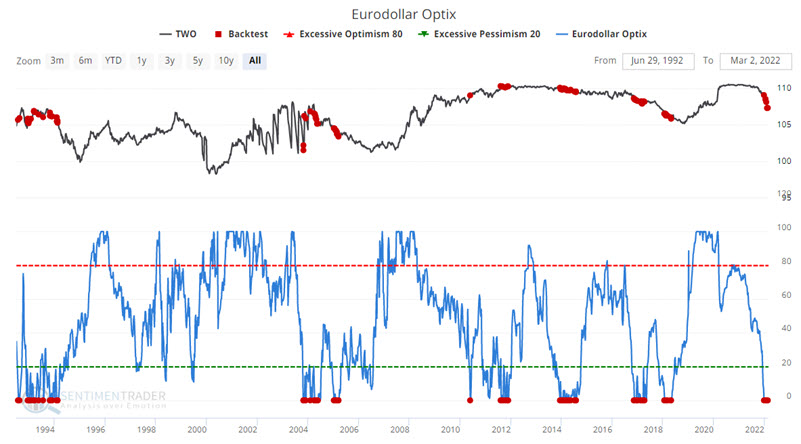
Let's run the same test using two-year treasury notes. The chart below displays two-year treasury futures and all days when Eurodollar Optix hit a reading of 0.
The table below displays a summary of the results.
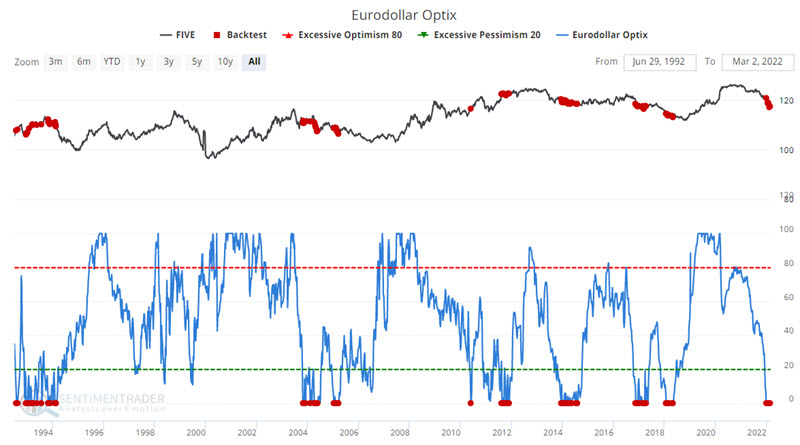
We see a similar bearish trend for the price of two-year treasuries. If we run the same test with five-year treasuries, we get similar - but less extreme - results.
Using corporate bonds
Let's take a look at results using corporate bonds. We will look at three different variations - high-grade corporates, low-grade (high-yield) corporates, and something in between. For this test, we will use the following ETFs:
- BND: Vanguard Total Bond Market Index Fund ETF Shares
- LQD: iShares iBoxx $ Investment Grade Corporate Bond ETF
- HYG: iShares iBoxx $ High Yield Corporate Bond ETF
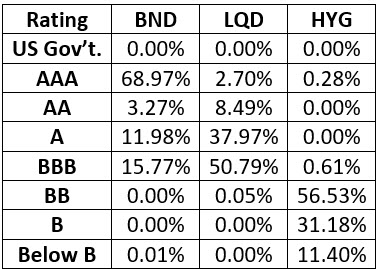
The relative holdings of these three ETFs appear in the table below.
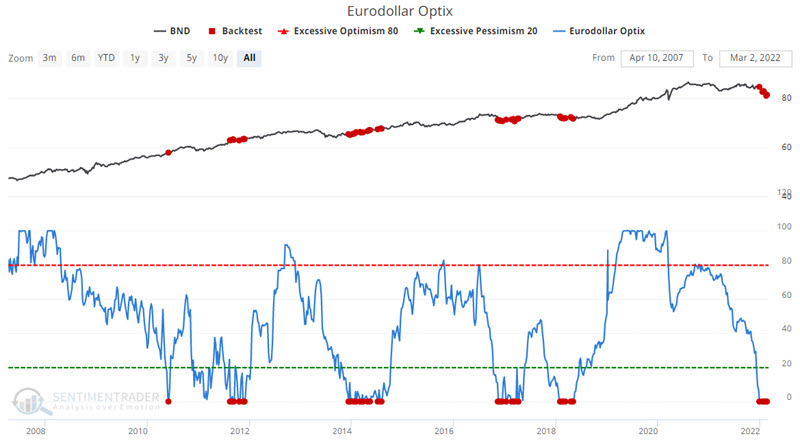
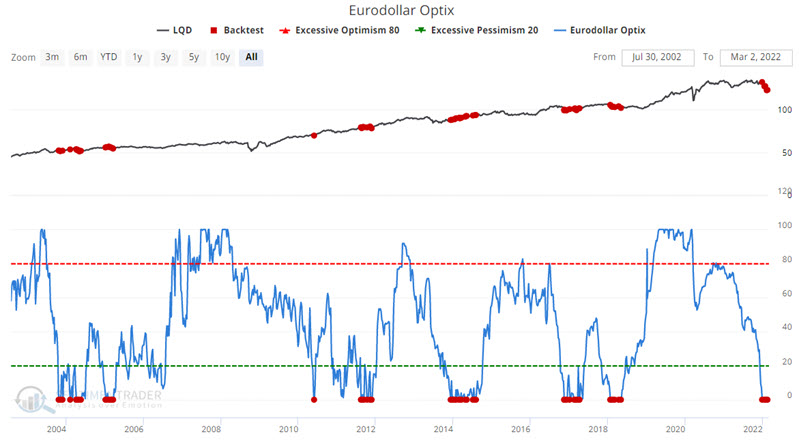
We start with high-grade bonds using BND.
Unlike Eurodollars and short-term treasuries, BND shows strong Win Rates 3 months and out.
Next is lesser-grade bonds using LQD.
LQD shows slightly lower Win Rates for three months and out but higher Average and Median returns.
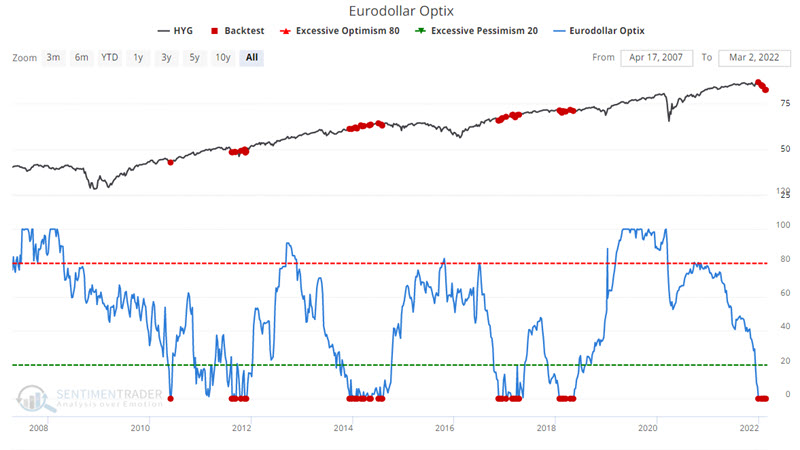
The chart and table below show similar results for high-yield bonds (HYG).
What the research tells us…
Analyzing data is one thing; drawing conclusions is another. Based on historical data, the recent readings for Eurodollar Optix suggest a short position in short-term bonds and a long position in high-grade to intermediate-grade corporate bonds. However, it should be noted that the historical results all took place in the context of an overall declining trend in interest rates. Whether that downtrend in rates is still in effect, how long it might last, and how bonds will react if and when that downtrend reverses in earnest are all important questions to ponder.


