Data &
Technology
Research
Reports
Report Solutions
Reports Library
Actionable
Strategies
Free
Resources
Simple Backtest Calculator
Simple Seasonality Calculator
The Kelly Criterion Calculator
Sentiment Geo Map
Public Research Reports
Free Webinar
Pricing
Company
About
Meet Our Team
In the News
Testimonials
Client Success Stories
Contact
Log inLoginSign up
< BACK TO ALL REPORTS

Institutions believe in stocks a lot more than mom-and-pop

Jason Goepfert
2020-05-14
A monthly survey of institutional versus individual sentiment on stocks shows that the latter is a lot more optimistic than the former. Responses to questions by Yale University showed that the spread between sentiment in the two groups is near the highest level in 30 years.

Institutions are a lot more optimistic than mom-and-pop, and that may not be a good thing.

The latest results from a monthly survey by Yale University show that overall confidence about stocks is high, and it's especially so among institutions. Please see the Yale University website for underlying charts and data.

The survey asks four questions, with the tabulations designed to show what percentage of respondents are optimistic.

  1. The percent of the population expecting an increase in the Dow in the coming year.
  2. The percent of the population expecting a rebound the next day should the market ever drop 3% in one day.
  3. The percent of the population who attach little probability to a stock market crash in the next six months.
  4. The percent of the population who think that the market is not too high.

Based on the latest responses to each question, institutions represented in the survey are about 65% confident in the market. Individuals, however, are only about 54% confident. That sets up a classic "smart money" versus "dumb money" battle.

We saw on Tuesday that it isn't usually that easy, though. Just because someone has more money or more education does not make them a better investor. If anything, it's the opposite.

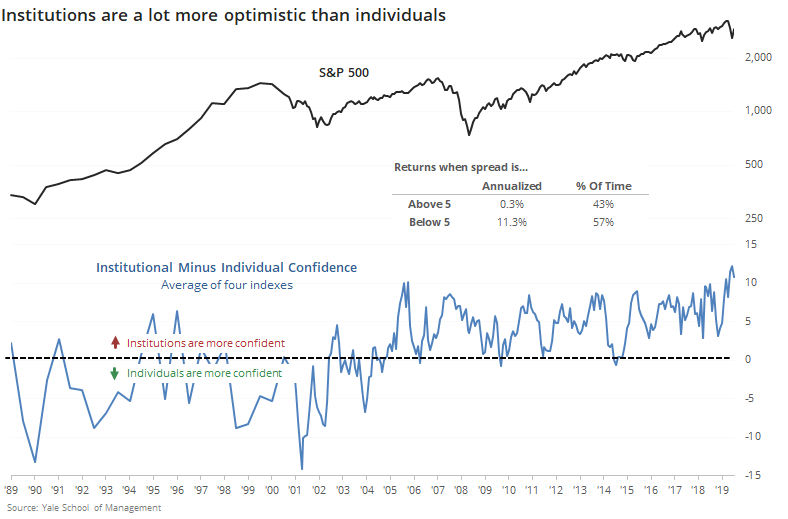
Below, we can see the spread between overall confidence levels in institutions vs. individuals.

While it ticked down in April, it's still near the highest level in more than 30 years. Looking at the S&P 500's annualized returns, it averaged only +0.3% when the spread was more than +5 (meaning institutions were quite a bit more optimistic than individuals) versus a healthy +11.3% when the spread was below +5.

The spread has been gyrating within a range since 2005, so if we only look at the annualized returns since then, it remained at +0.3% when the spread was above +5 and it rose to +14.9% when below. So, it has only gotten stronger as a contrary indicator. This is not nearly enough to scream "sell" but it has a long enough history to at least suggest some caution.

Sorry, you don't have access to this report

Upgrade your subscription plan to get access
Go to Dasboard
DATA &
TECHnologies
IndicatorEdge
‍
BackTestEdge
‍
Other Tools
‍
DataEdge API
RESEARCH
reports
Research Solution
‍
Reports Library
‍
actionable
Strategies
Trading Strategies
‍
Smart Stock Scanner
‍
FREE
RESOUrCES
Simple Backtest
Calculator
Simple Seasonality
Calculator
The Kelly Criterion
Calculator
Sentiment Geo Map
‍
Public Research Reports
‍
Free Webinar
COMPANY
‍
About
‍
Meet our Team
‍
In the News
‍
Testimonials
‍
Client Success Stories
Pricing
Bundle pricing
‍
Announcements
‍
FAQ
© 2024 Sundial Capital Research Inc. All rights reserved.
Setsail Marketing
TermsPrivacyAffiliate Program
Risk Disclosure: Futures and forex trading contains substantial risk and is not for every investor. An investor could potentially lose all or more than the initial investment. Risk capital is money that can be lost without jeopardizing ones’ financial security or life style. Only risk capital should be used for trading and only those with sufficient risk capital should consider trading. Past performance is not necessarily indicative of future results.

Hypothetical Performance Disclosure: Hypothetical performance results have many inherent limitations, some of which are described below. No representation is being made that any account will or is likely to achieve profits or losses similar to those shown; in fact, there are frequently sharp differences between hypothetical performance results and the actual results subsequently achieved by any particular trading program. One of the limitations of hypothetical performance results is that they are generally prepared with the benefit of hindsight. In addition, hypothetical trading does not involve financial risk, and no hypothetical trading record can completely account for the impact of financial risk of actual trading. for example, the ability to withstand losses or to adhere to a particular trading program in spite of trading losses are material points which can also adversely affect actual trading results. There are numerous other factors related to the markets in general or to the implementation of any specific trading program which cannot be fully accounted for in the preparation of hypothetical performance results and all which can adversely affect trading results.

Testimonial Disclosure: Testimonials appearing on this website may not be representative of other clients or customers and is not a guarantee of future performance or success.