
Inflation improving but still a headwind

Key points
- Extreme inflation or deflation results in uncertainty for the economy and stocks
- The consumer price index, producer price index, and real interest rates all offer important clues for investors
- There are specific signs that investors can look for to identify if inflation is a headwind or tailwind for stocks
The stock market loves moderate CPI inflation
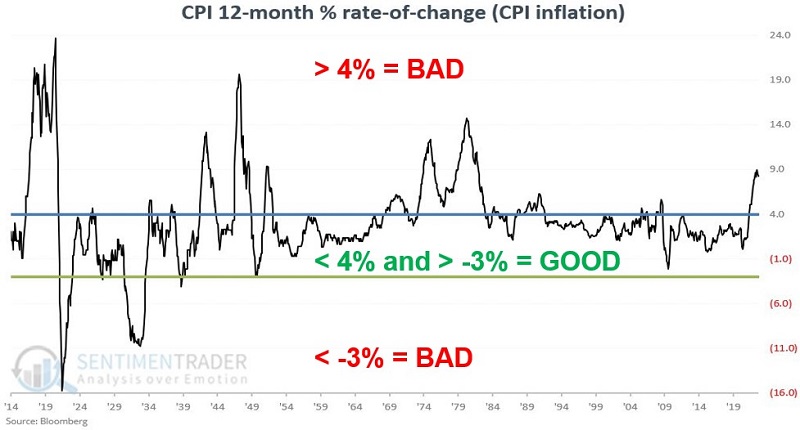
A certain amount of inflation or deflation is normal and expected. The problem comes when inflation rises or falls outside of the normal range. For our purposes, we refer to the 12-month % rate-of-change in the Consumer Price Index as CPI Inflation.
- Any reading between +4% and -3% is moderate CPI inflation
- Any reading above +4% is extreme CPI inflation
- Any reading below -3% is extreme CPI deflation
This designation is made at month-end regardless of what time of month the latest CPI reading occurred. The chart below displays the history of CPI Inflation since 1914.
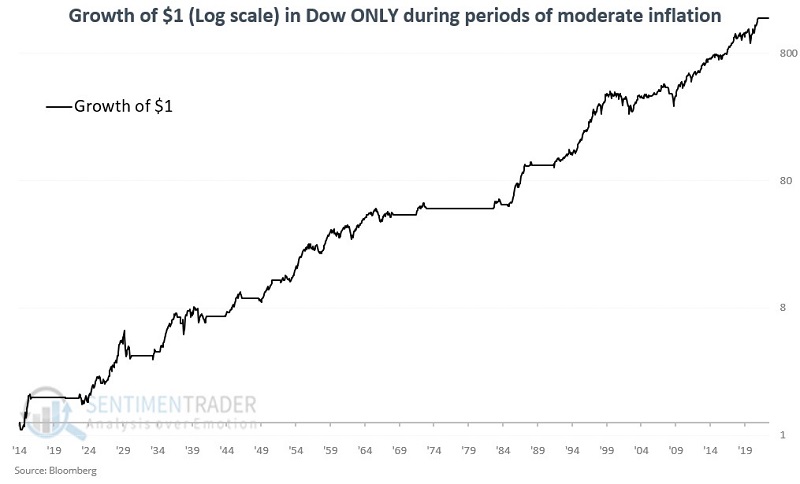
The chart below displays the cumulative growth of $1 invested in the Dow Jones Industrial Average if the previous month ended with CPI Inflation in the moderate inflation range between +4% and -3%. The cumulative % gain for the Dow since 1914 during moderate inflation is +150,464%.
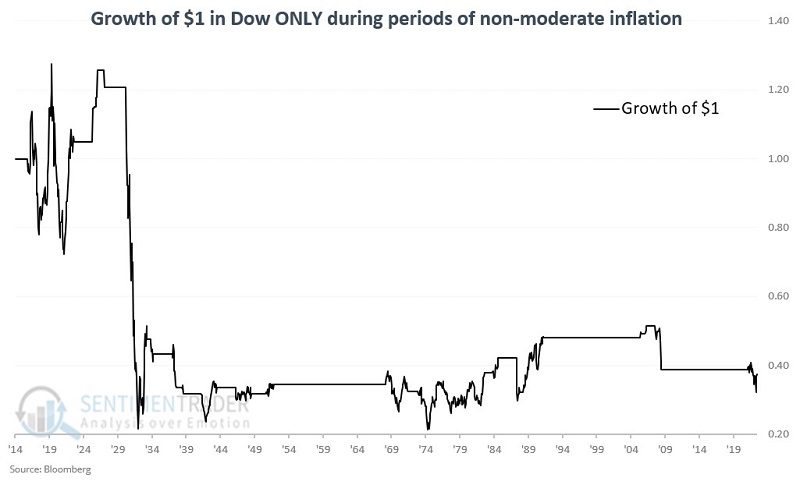
When CPI Inflation moves outside the moderate range, results take a definite turn for the worse. The chart below displays the Dow's cumulative percentage return (-63%) when inflation has been outside the moderate range since 1914.
Most of the damage occurred during severe deflation in the 1930s. Still, if we look only at results since 1940 in the chart below, we still see a great deal of market volatility and less than stellar stock market performance.
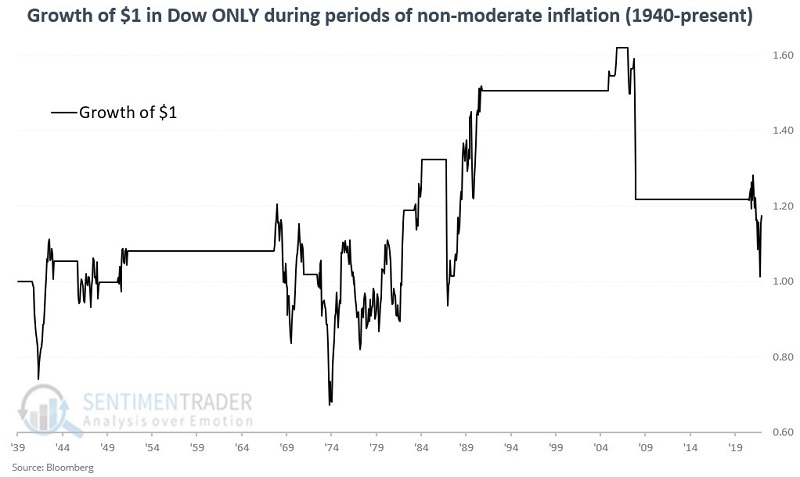
The stock market can advance with CPI Inflation above +4%. Nevertheless, high inflation is clearly a headwind for the market. Our measure of CPI inflation shows it at just under 8%. A drop below 4% is needed to turn this measure from a market headwind to a market tailwind.
Extremes in Producer Price Index inflation are also problematic
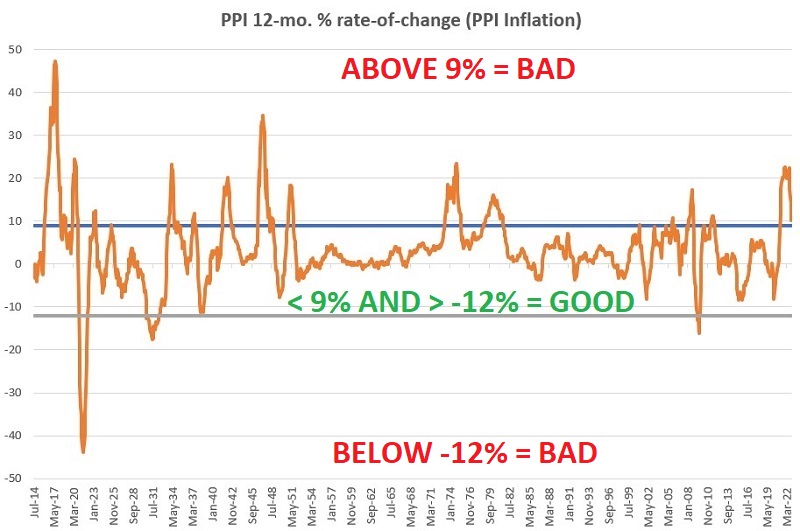
For our purposes, we refer to the 12-month % rate-of-change in the Producer Price Index as PPI inflation. PPI inflation has a broader range of "normal" than CPI. Any reading below +9% and above -12% for the PPI is moderate PPI Inflation. The chart below displays PPI Inflation since 1914.
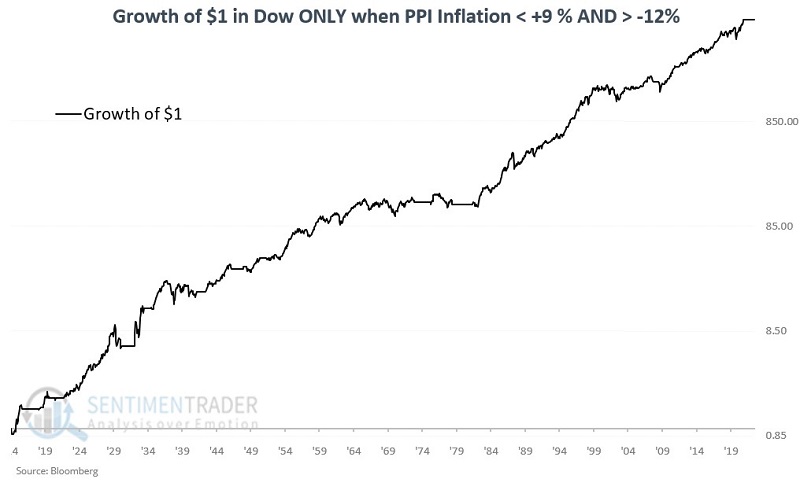
The chart below displays the growth of $1 in the Dow Jones Industrial Average if the previous month ended with PPI Inflation in the moderate inflation range between +9% and -12%. The cumulative % gain for the Dow since 1914 during moderate inflation is 799,187%
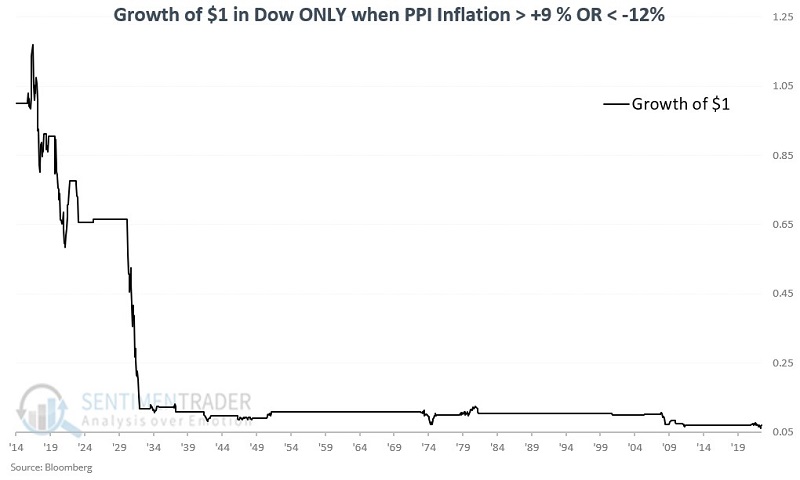
The chart below displays the growth of $1 in the Dow when PPI inflation was above +9% or below -12%.
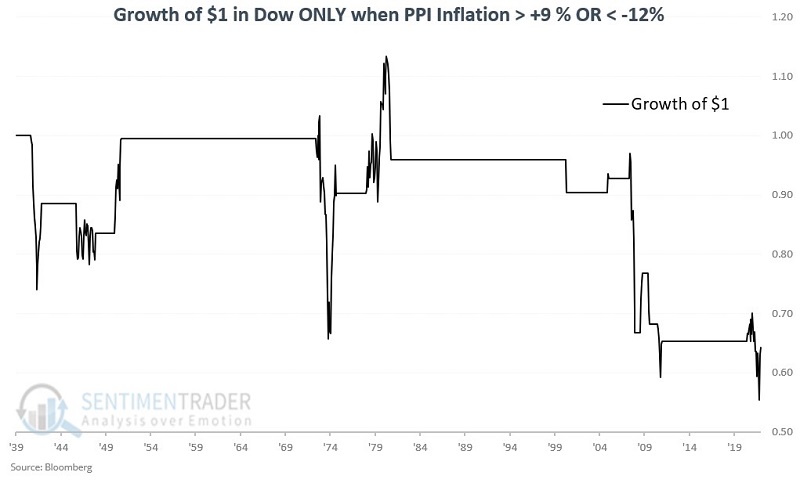
Once again, most of the damage occurred during severe deflation in the 1930s. The chart below shows the growth of $1 in the Dow when PPI inflation was above +9% or below -12% starting in 1940.
Our measure of CPI inflation shows it at about 10.3%. A drop below 9% is needed to turn this measure from a market headwind to a market tailwind.
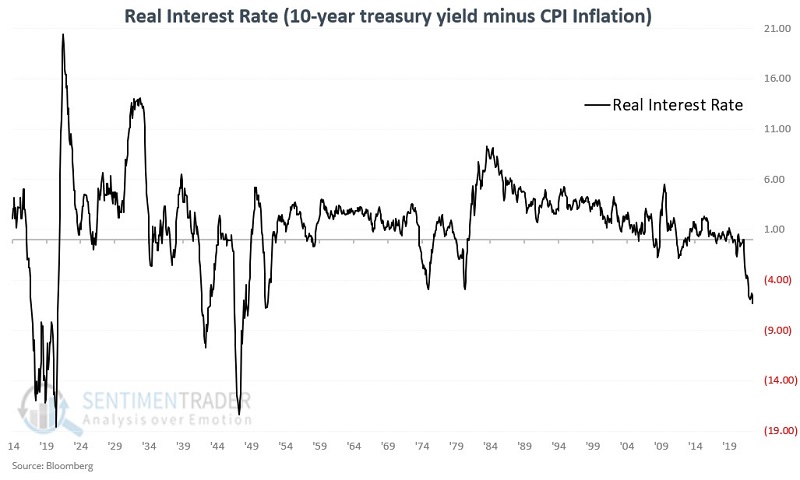
Real interest rates as an inflation indicator
For our purpose, the "real interest rate" is measured at the end of each month as follows: 10-year treasury yield minus CPI Inflation rate.
If the real interest rate is above -0.6, we deem it favorable for stocks. A real interest rate of -0.6 or lower is considered unfavorable for stocks. The chart below displays the real interest rate since 1914.
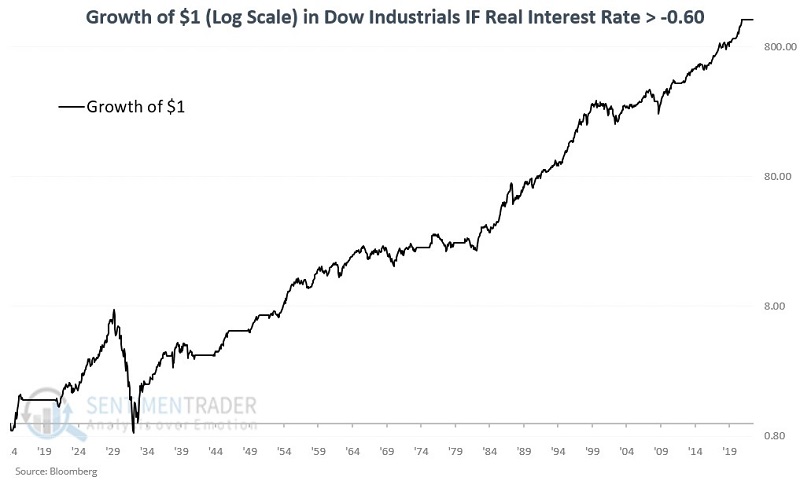
The chart below displays the growth of $1 in the Dow Jones Industrial Average if the previous month ended with real interest rates above -0.6. The cumulative percentage return for the Dow since 1914 with real interest rates above -0.6 is +129,137%.
The chart below displays the cumulative percentage return when real interest rates are below -0.6.
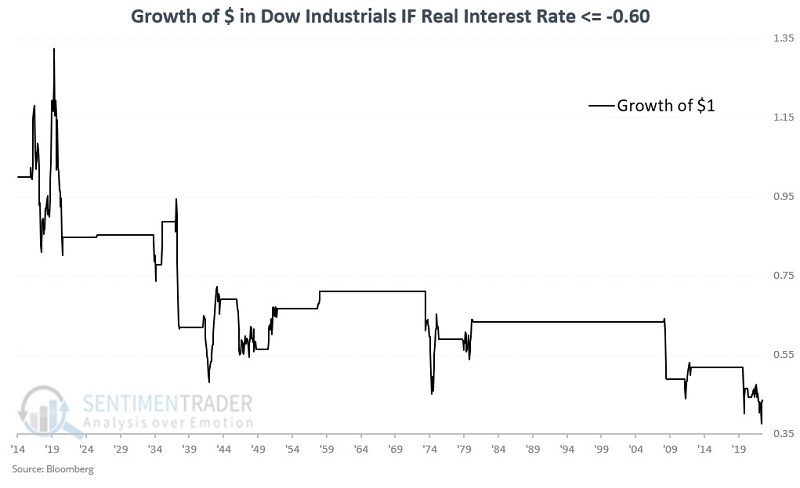
The chart above clearly highlights that negative real interest rates are a strong headwind for stocks. The good news is that the real rates have narrowed from -6.34 at the end of July to -3.96 in mid-November. The bad news is that this figure remains well below the -0.60 level we need to see to remove this indicator from the bearish side of the ledger.
What the research tells us…
Extreme inflation or deflation causes stress in the economy, creating significant uncertainty for the stock market. And if there is one thing that can be about the stock market, it is that the market hates uncertainty. This is obvious in the charts above, which show extreme volatility and overall negative returns for stocks when inflation/deflation is extreme. CPI, PPI, and real interest rates remain at excessive levels. This does not mean the stock market cannot rally, but this state of affairs remains a significant headwind for the stock market.