
Inflation and Staples versus Discretionary - the ETF Edition

Key Points
- In a previous piece, I highlighted that consumer discretionary tends to outperform consumer staples when inflation is moderate and vice versa when inflation is extreme
- In this piece, we will look at results using ETF data rather than index data to get more of a "real-world" viewpoint
XLP and XLY
Ticker XLP (Consumer Staples Select Sector SPDR Fund) is an ETF that tracks the Consumer Staples Select Sector Index. Ticker XLY (Consumer Discretionary Select Sector SPDR Fund) is an ETF that tracks the Consumer Discretionary Select Sector Index.
Moderate inflation versus extreme inflation
We measure inflation using the 12-month rate of change in the Consumer Price Index. Regardless of when CPI data is reported, we will only analyze the latest available data at the end of each month.
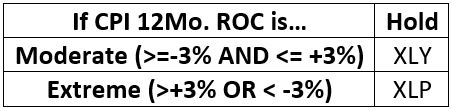
The rules:
- We will use the month-end reading to decide what to hold during the following month
- If the latest CPI inflation reading is relatively high (greater than or equal to +3%) OR relatively low (less than or equal to -3%, i.e., deflation) at the end of the current month, we will hold XLP during the following month
- If the latest CPI Inflation reading is "moderate" (greater than -3% to less than +3%), we will hold XLY the following month.
We will calculate the results by using XLP and XLY total return data from January 1, 1999, through July 18, 2022.
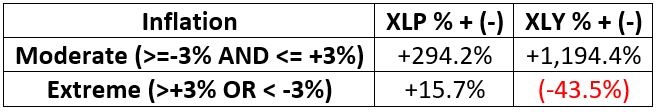
The table below illustrates the strategy rules.
Sector performance during moderate inflation
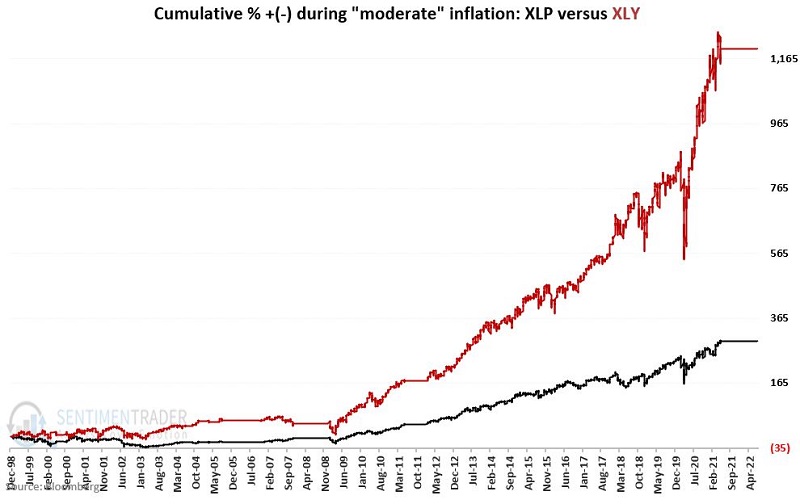
We define "moderate" inflation as any 12-month CPI % change between +3 and -3%. The chart below displays the cumulative % growth of investment in XLY (red line) and XLP (black line) ONLY during periods of moderate inflation.
Results:
- XLY = +1,194%
- XLP = +294%
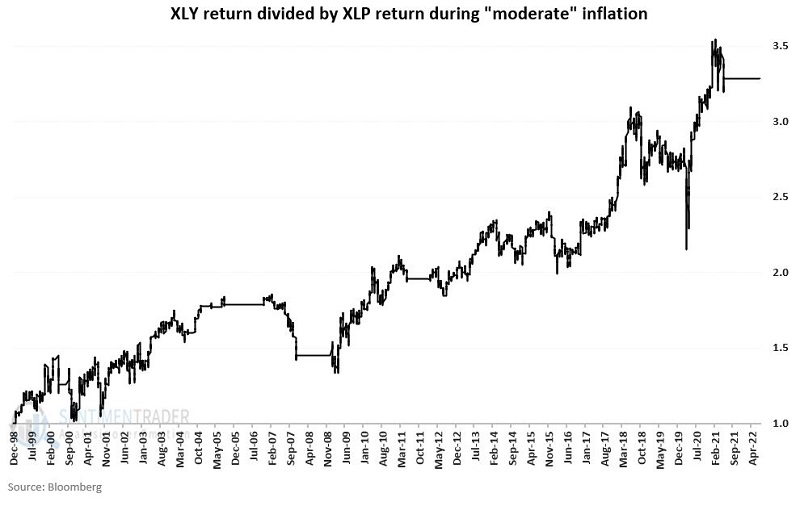
To put results into perspective, the chart below displays:
- Growth in XLY return during moderate inflation divided by growth in XLP
Sector performance during extreme inflation
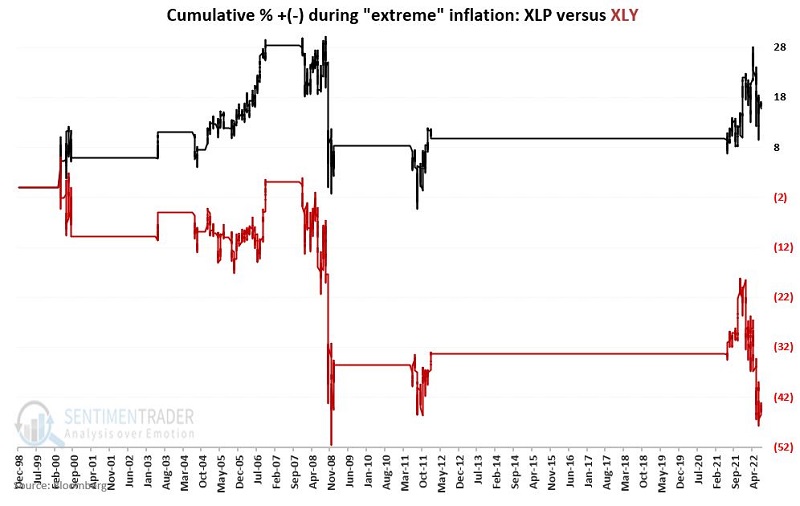
We define "extreme" inflation as any 12-month CPI % change above +3 or below -3%. The chart below displays the cumulative % growth of investment in XLY (red line) and XLP (black line) ONLY during periods of extreme inflation.
Results:
- XLY = (-43.5%)
- XLP = +15.7%
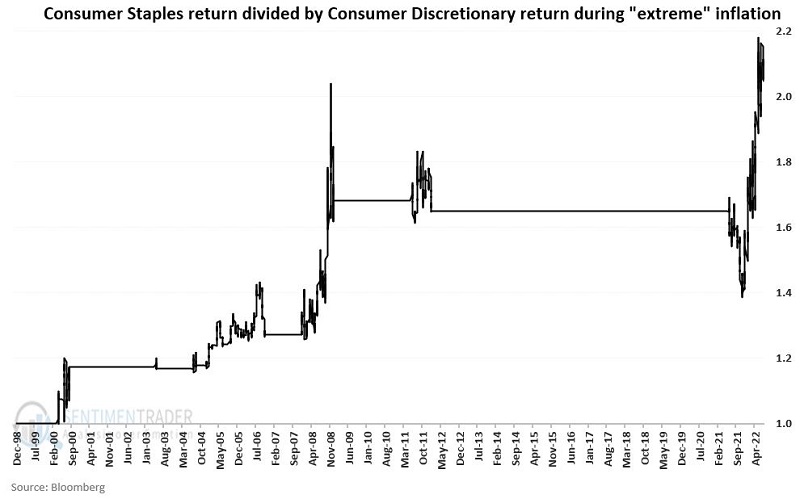
To put results into perspective, the chart below displays:
- Growth in XLP return during extreme inflation divided by the growth in XLY
Summary of results
The results of switching
Let's compare a simple switching methodology to a Buy/Hold/Rebalance approach to fully illustrate the effect of switching between staples and discretionary based on inflation.
Switching Rules:
- If a month ends with CPI % <= +3% and >=-3% then hold XLY
- If a month ends with CPI % > +3% or < -3% then hold XLP
Buy/Hold/Rebalance Rules:
- Split 50/50 between XLP and XLY
- Rebalance to 50/50 at the end of each calendar year
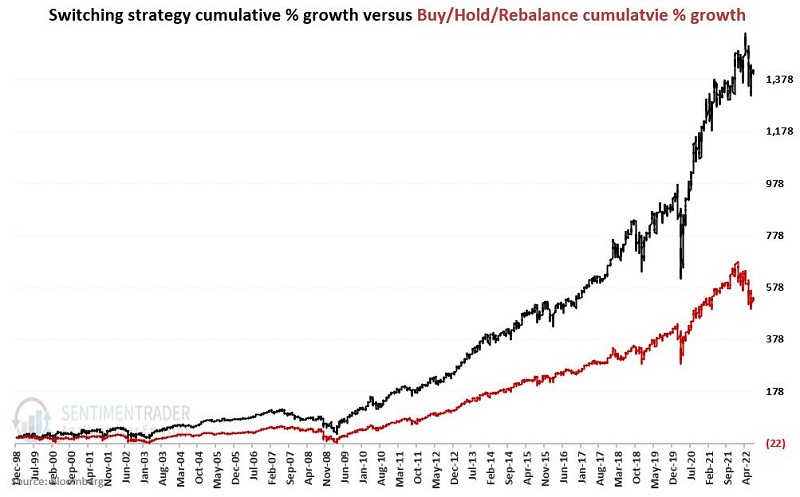
The chart below displays the comparative cumulative growth for Switching versus Buy/Hold/Rebalance
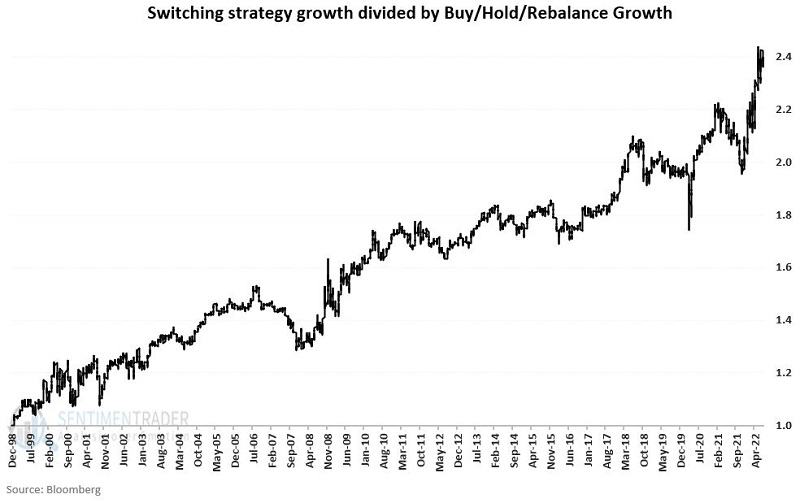
Lastly, the chart below displays the growth of an investment using the Switching method divided by the growth of an investment using the Buy/Hold /Rebalance method.
The table below displays a summary of performance yearly.
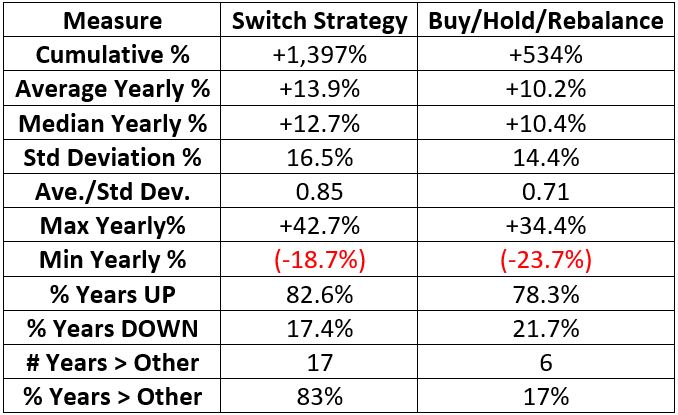
The last signal occurred on 5/31/2021 when CPI inflation rose above 3%, prompting the Switching Strategy to move to XLP. Since that time:
- Switching strategy = +5.3%
- Buy/Hold Rebalance = (-4.7%)
What the research tells us…
Switching strategy returns and the ratio between switching strategy and buy/hold/rebalance returns are far from a "straight line." Nevertheless, the past 23+ years of ETF data results lend credence to the initial article's theory that moderate inflation favors consumer discretionary and extreme inflation favors the more defensive consumer staples sector.