
Industry momentum confirms the bullish uptrend in stocks

Key points:
- A substantial number of sub-industry groups are exhibiting positive year-over-year returns
- Since 1948, similar price momentum dynamics preceded a 100% win rate for the S&P 500 a year later
- The TCTM Composite Confirmation Model signal count increased with the new signal
Another big-picture indicator confirms the bullish backdrop for stocks
In a recent research note, I highlighted a bullish shift in the percentage of S&P 500 stocks trading within 5% of their 252-day high. Within my research framework, this particular market message aligns with what I classify as a recovery signal. Although not as timely as short-term breadth thrusts, it provides invaluable insights into the overall market backdrop.
Last week, another big-picture indicator incorporating price action for small, medium, and large-capitalization stocks experienced a similar bullish shift.
For the 30th time since 1933, the percentage of sub-industry groups with a positive 1-year rolling return cycled from less than 20% to greater than 80%, triggering a buy signal for a TCTM Composite Confirmation Model component.
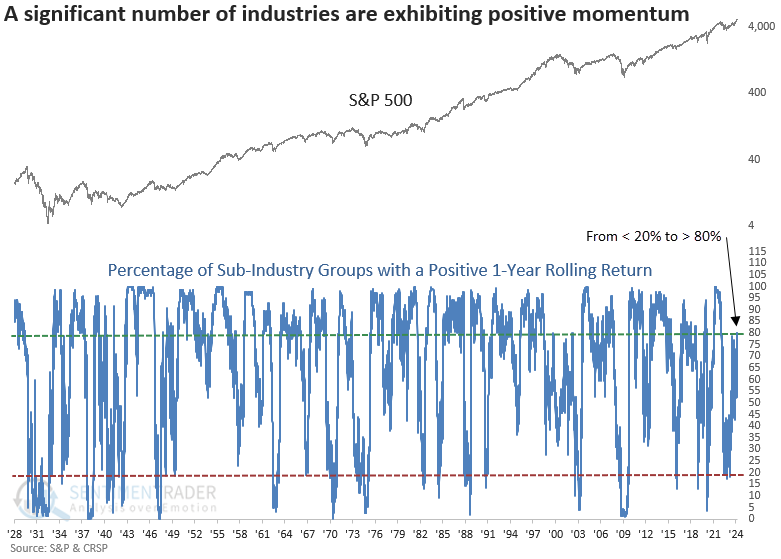
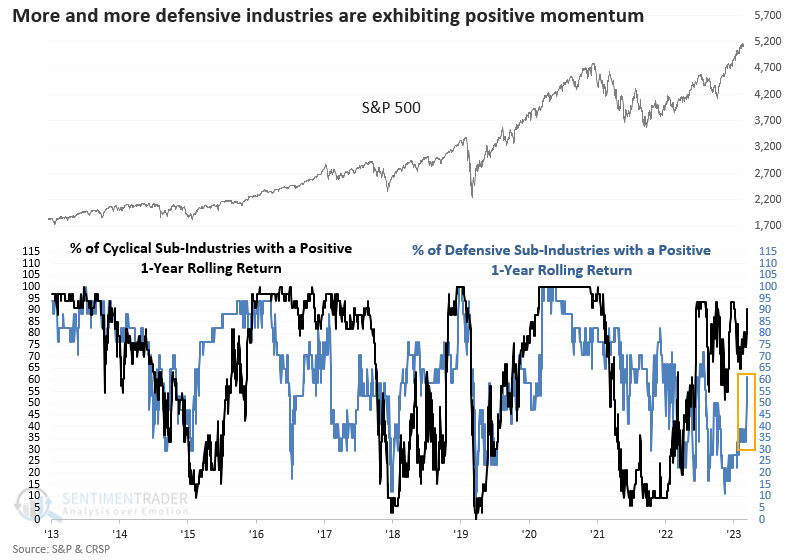
The recent uptick in the proportion of sub-industries exhibiting a positive 1-year rolling return can be attributed to a resurgence in defensive-oriented groups, which encountered difficulties amid the FOMC tightening cycle.
If you recall, cyclical industries experienced a positive price momentum shift last summer, providing a bullish market message when many called for a recession.
Similar shifts in price momentum produced bullish outcomes
A resurgence in positive long-term price momentum for sub-industry groups heralds a favorable outlook for the S&P 500 over the subsequent year. Since the 1946-49 drawdown, precedents have been outstanding, showing a gain every single time a year later.
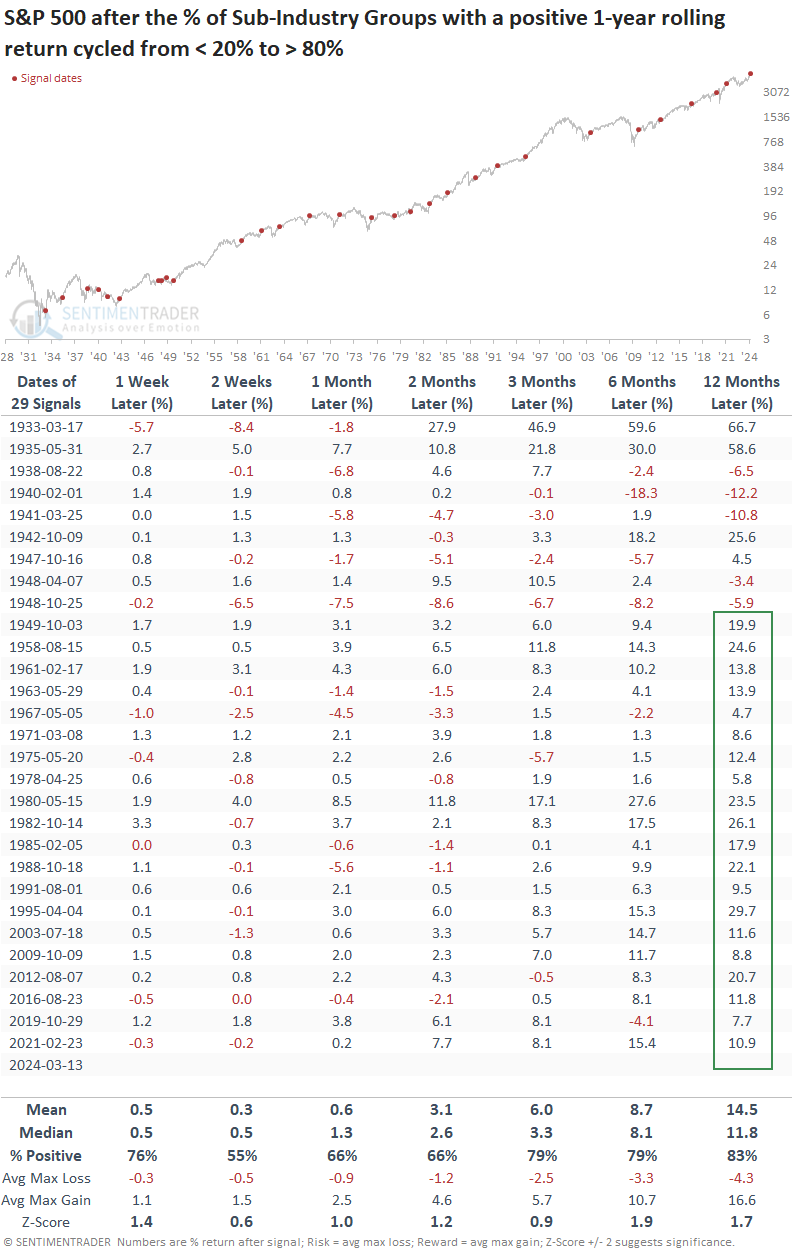
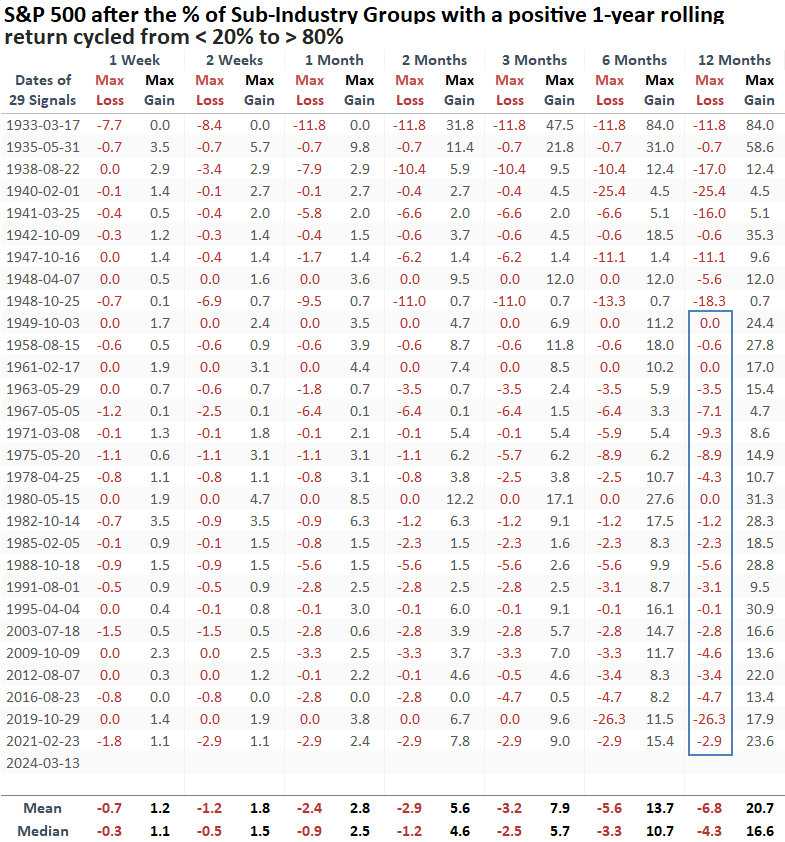
Since the bear market of 1946-49, drawdowns one year later have consistently remained subdued, with no instance of a maximum loss exceeding -10%, except for a single occurrence triggered prior to the onset of the Covid crash.
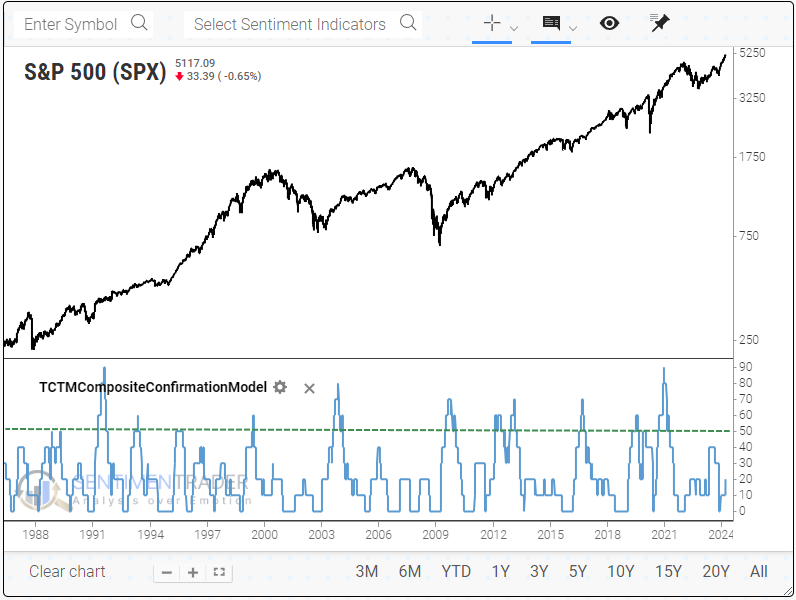
Composite Confirmation Model
While the TCTM Composite Confirmation Model signal count ticked up to 20%, it's looking increasingly likely that the composite will fail to generate a confirmation signal, marking the first time without an alert following a bear market.
What the research tells us...
A voting member in the TCTM Composite Confirmation Model generated a new alert when the percentage of sub-industry groups with a positive 1-year rolling return cycled from less than 20% to greater than 80%, indicating that more and more groups exhibited positive momentum, a common characteristic of uptrends. After similar shifts in long-term price momentum, the S&P 500 tended to rally over the subsequent year, especially since 1949. While the big-picture market outlook remains favorable, indexes and stocks rarely move up in a straight line.