
A bullish recovery in cyclical industries

Key points:
- The percentage of cyclical sub-industry groups with a positive 1-year return cycled from < 20% to > 80%
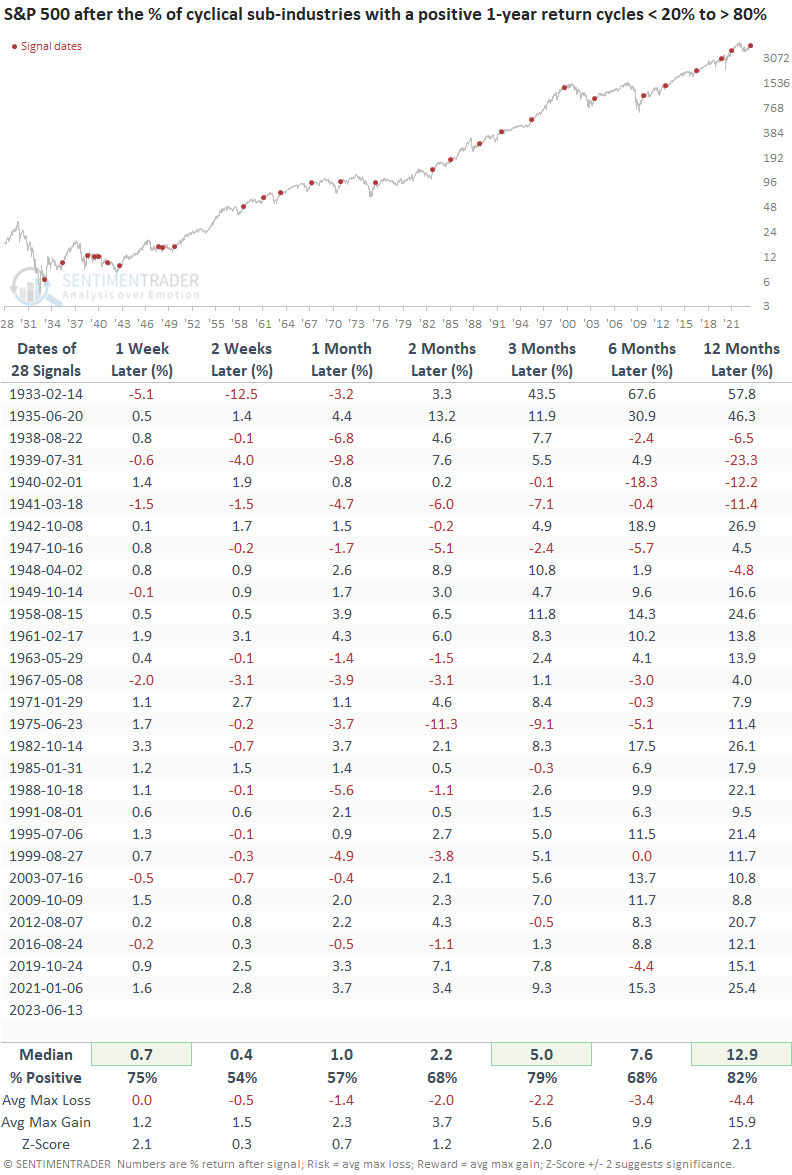
- Similar recoveries in cyclical industries led to solid gains over the next year
- Signals that occurred with manufacturing in contraction territory were higher a year later every time
A bullish recovery in cyclical groups
With the calendar aligning with last year's plunge in stocks to the June 2022 low, which marked the internal bottom for several groups, long-term price momentum measures like rolling returns are reversing upward by a meaningful amount.
On Tuesday, the percentage of cyclical sub-industry groups with a positive 1-year return crossed above 80%, joining other indexes, sectors, and industries with bullish recovery signals.
Although Technology stands as the undisputed market leader, it's important to recognize the improvements in other cyclical groups.
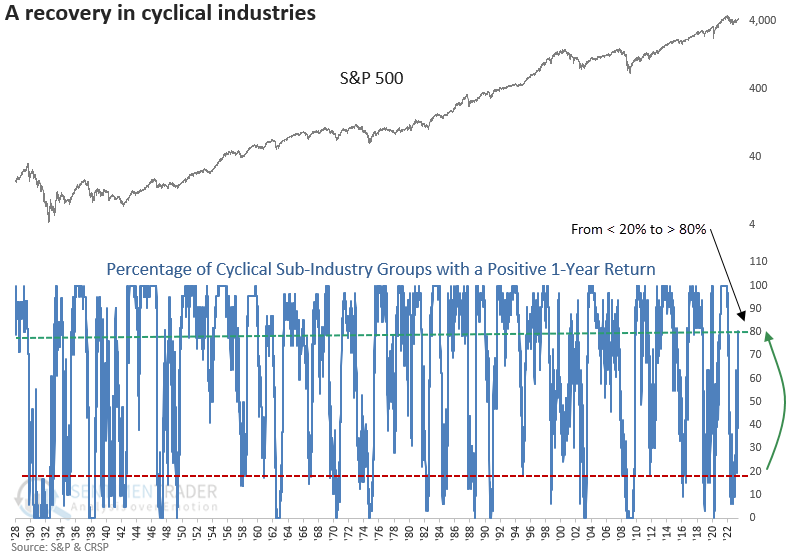
The cyclical sub-industry composite is comprised of 31 groups covering autos, housing, travel, banking, construction, transportation, semiconductors, and several others.
Comparable rebounds in price momentum presaged solid gains
A resurgence in cyclical sub-industry groups heralds positive returns and win rates for the S&P 500 across various timeframes. However, this indicator faced challenges during the bear market of 1937-1942, mirroring the performance of other recovery signals I have previously discussed. Nevertheless, from 1948 onwards, it has consistently delivered flawless results a year later.
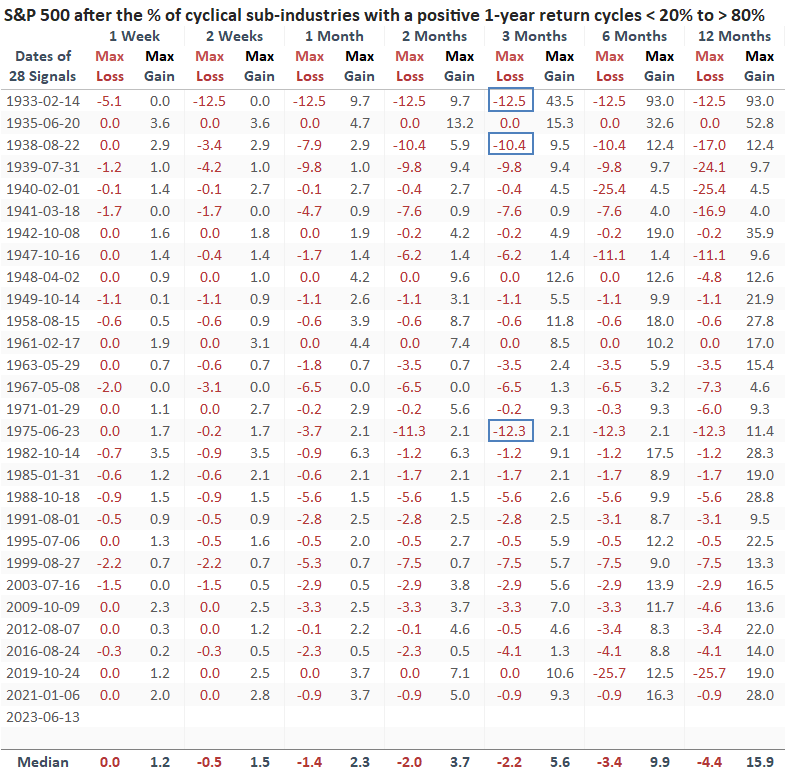
During the next three months, the S&P 500 encountered just three instances of maximum losses exceeding -10%, with the last of these events happening in 1975.
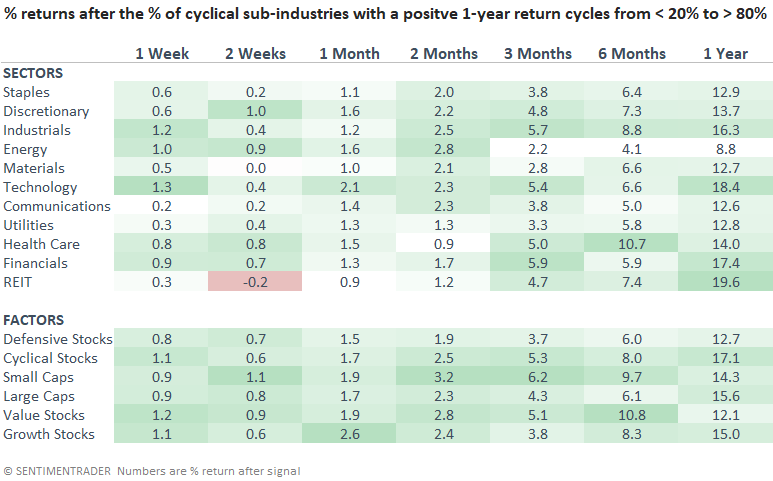
Over medium and long-term durations, cyclical stocks consistently outperform defensive stocks in terms of overall performance.
Signals when the ISM Manufacturing PMI was in contraction territory
While positive, the results are less robust across short to medium-term time frames for precedents when the ISM Manufacturing PMI survey indicated contraction, as it does presently. However, a year later, the S&P 500 was higher in every case.
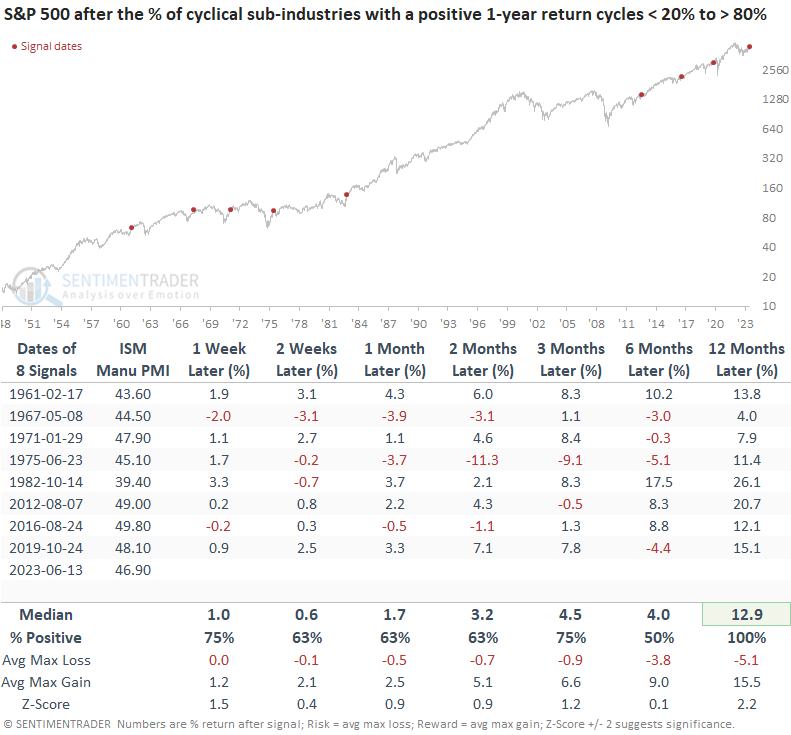
ISM data started in 1948. So, the sample size is smaller.
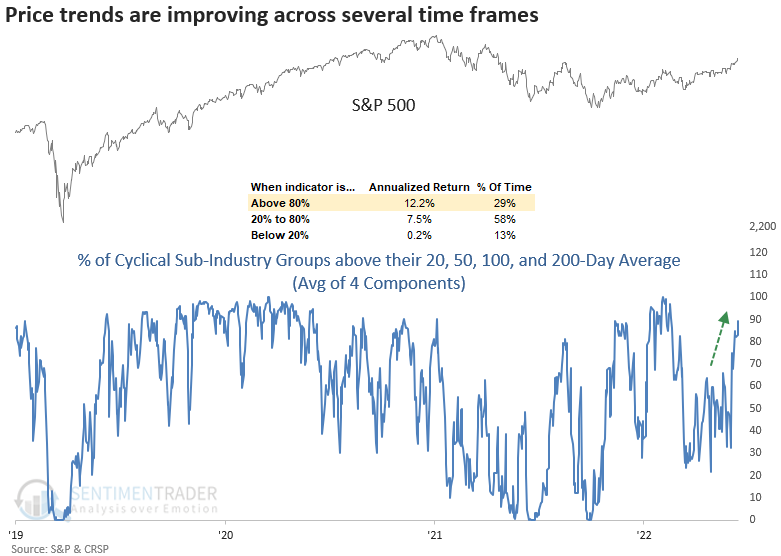
Market breadth indicators
The narrow market breadth conditions have experienced a turnaround, especially in cyclical industries. The average percentage of cyclical groups trading above their 20, 50, 100, and 200-day moving averages has reached its highest level in more than three months.
What the research tells us...
In the past six months, Sentimentrader's team has presented a series of insightful studies indicating that the equity market is entering a new bullish phase. The recent rebound in cyclical industries further strengthens the argument for investing in stocks. With broader participation, the only potential concern lies in macroeconomic data. Nonetheless, it's important to remember that market trends are rarely linear, and occasional minor corrections and consolidations are natural occurrences.