Data &
Technology
Research
Reports
Report Solutions
Reports Library
Actionable
Strategies
Free
Resources
Simple Backtest Calculator
Simple Seasonality Calculator
The Kelly Criterion Calculator
Sentiment Geo Map
Public Research Reports
Free Webinar
Pricing
Company
About
Meet Our Team
In the News
Testimonials
Client Success Stories
Contact
Log inLoginSign up
< BACK TO ALL REPORTS

Industrial stocks storm back

Jason Goepfert
2020-09-15
Over the past few months, industrial stocks have stormed back relative to the broader market. The ratio of industrial stocks to the S&P 500 recently jumped more than 10% over a 3-month period, one of the most impressive comebacks since 1928. Other big surgest mostly led to lower long-term returns for stocks, however.

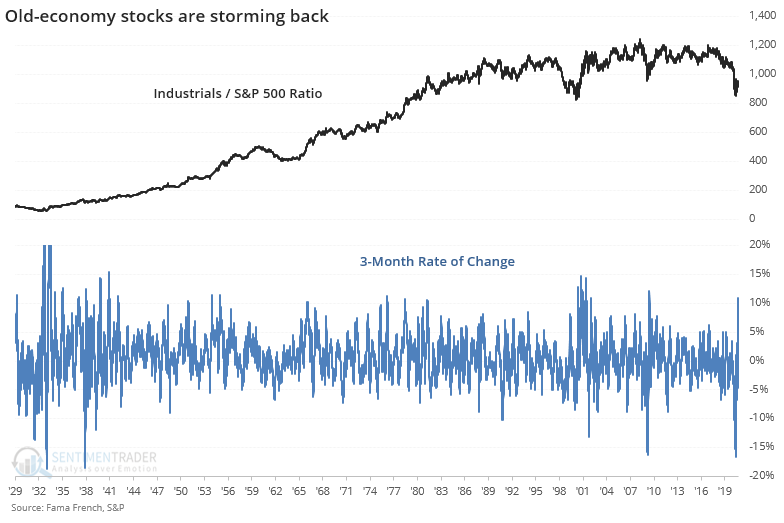
Industrials are surging relative to the rest of the market. This is taken as a good sign for the market as a whole because investors are moving out of the formerly hot sectors and into ones that benefit most on an economic recovery. 

We can see below how much the ratio between these stocks and the broader market has swung. A rise of 10% or more, like we've seen in recent months, is historically extreme dating back to 1928.

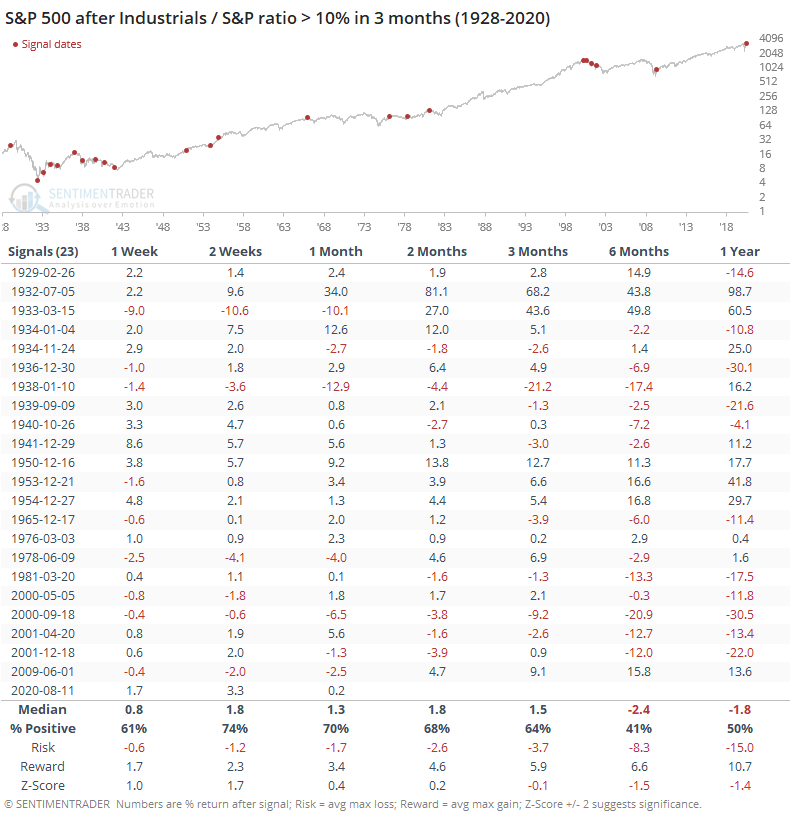
When these stocks rebounded by this much, relative to the broader market, it has preceded decent shorter-term returns for the broader market and poor long-term ones. The positive 6-month returns came mostly after protracted declines in the 1930s, 1950s, and in 2009.

The ratio between them was mediocre. There was a modest tendency for industrials to keep outperforming the broader market but it was slight, and not much beyond random.

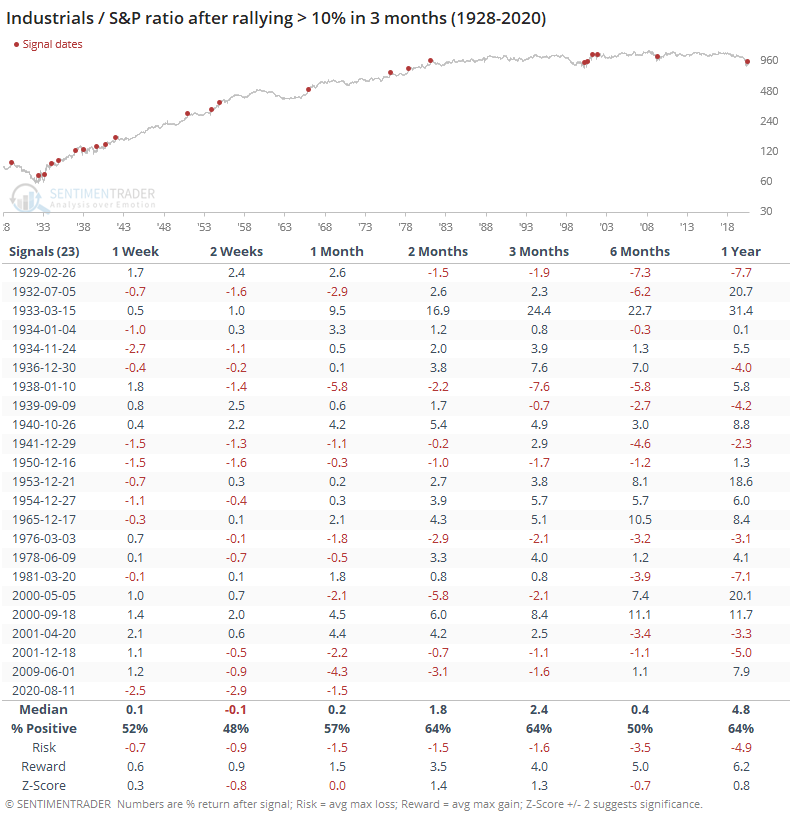
The best argument about better longer-term returns is that the last time the ratio cycled from -10% to +10% was in June 2009, though even that didn't preclude the ratio from falling over the next few months.

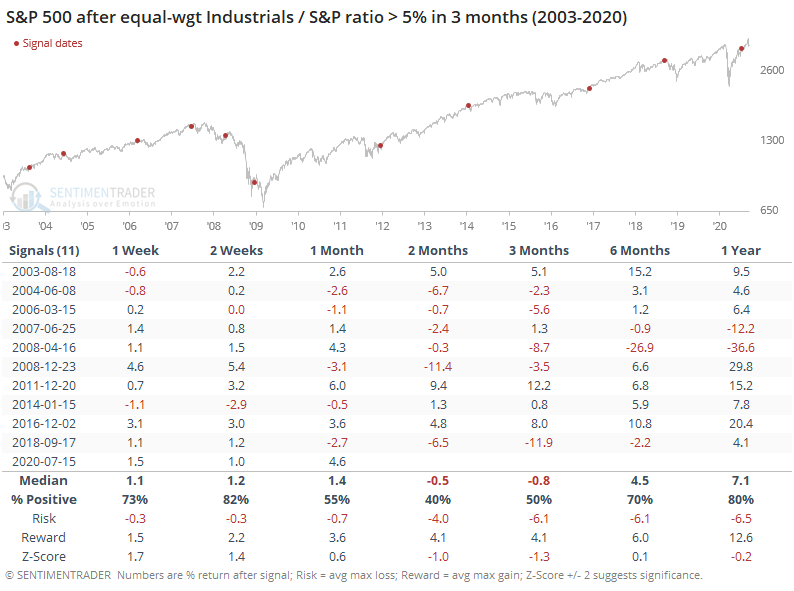
What's being taken as an even better sign is that the average industrial stock has jumped relative to the average stock in other sectors. The equal-weighted industrial index has also surged relative to the equal-weighted S&P 500.

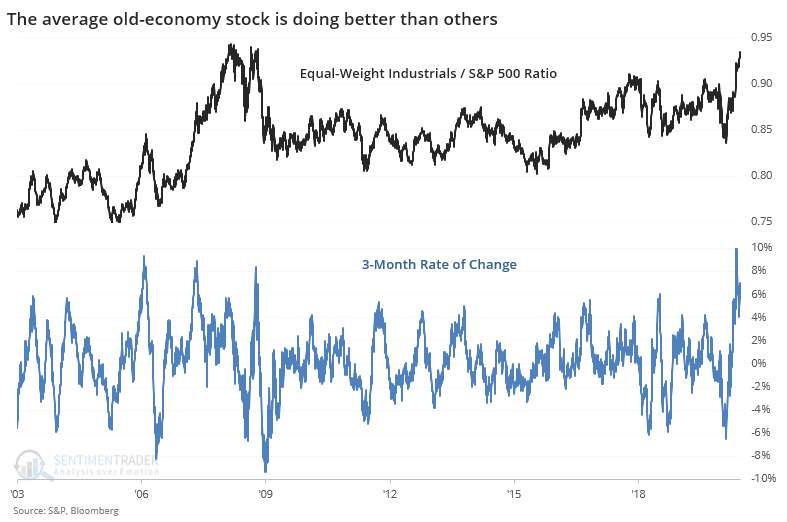
These indexes only go back to 2003, so history is limited and dominated by bull markets. Regardless, the S&P 500's returns over the medium-term were mediocre at best. 

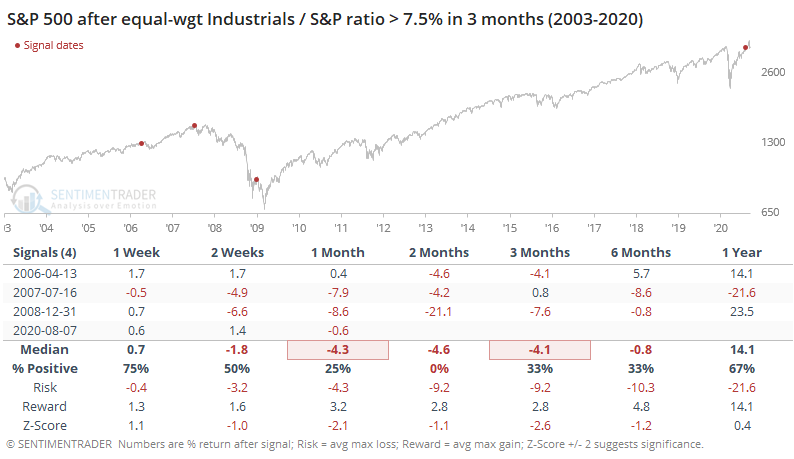
This time, the swing has been even more impressive at +7.5% and returns after the few precedents were even worse.

There are all kinds of smart-sounding reasons why the surge in this ratio should be a good sign for the broader market. Cherry-picked examples from a few charts can "prove" those theories correct. But when we look objectively at a long history, it becomes a lot harder to rely on this as a reason to believe the risk/reward is more positive now than it was months ago. Maybe this will be one of those times when a massive relative surge in industrial stocks proves to be a good sign. It's not the base case.

Sorry, you don't have access to this report

Upgrade your subscription plan to get access
Go to Dasboard
DATA &
TECHnologies
IndicatorEdge
‍
BackTestEdge
‍
Other Tools
‍
DataEdge API
RESEARCH
reports
Research Solution
‍
Reports Library
‍
actionable
Strategies
Trading Strategies
‍
Smart Stock Scanner
‍
FREE
RESOUrCES
Simple Backtest
Calculator
Simple Seasonality
Calculator
The Kelly Criterion
Calculator
Sentiment Geo Map
‍
Public Research Reports
‍
Free Webinar
COMPANY
‍
About
‍
Meet our Team
‍
In the News
‍
Testimonials
‍
Client Success Stories
Pricing
Bundle pricing
‍
Announcements
‍
FAQ
© 2024 Sundial Capital Research Inc. All rights reserved.
Setsail Marketing
TermsPrivacyAffiliate Program
Risk Disclosure: Futures and forex trading contains substantial risk and is not for every investor. An investor could potentially lose all or more than the initial investment. Risk capital is money that can be lost without jeopardizing ones’ financial security or life style. Only risk capital should be used for trading and only those with sufficient risk capital should consider trading. Past performance is not necessarily indicative of future results.

Hypothetical Performance Disclosure: Hypothetical performance results have many inherent limitations, some of which are described below. No representation is being made that any account will or is likely to achieve profits or losses similar to those shown; in fact, there are frequently sharp differences between hypothetical performance results and the actual results subsequently achieved by any particular trading program. One of the limitations of hypothetical performance results is that they are generally prepared with the benefit of hindsight. In addition, hypothetical trading does not involve financial risk, and no hypothetical trading record can completely account for the impact of financial risk of actual trading. for example, the ability to withstand losses or to adhere to a particular trading program in spite of trading losses are material points which can also adversely affect actual trading results. There are numerous other factors related to the markets in general or to the implementation of any specific trading program which cannot be fully accounted for in the preparation of hypothetical performance results and all which can adversely affect trading results.

Testimonial Disclosure: Testimonials appearing on this website may not be representative of other clients or customers and is not a guarantee of future performance or success.