Data &
Technology
Research
Reports
Report Solutions
Reports Library
Actionable
Strategies
Free
Resources
Simple Backtest Calculator
Simple Seasonality Calculator
The Kelly Criterion Calculator
Sentiment Geo Map
Public Research Reports
Free Webinar
Pricing
Company
About
Meet Our Team
In the News
Testimonials
Client Success Stories
Contact
Log inLoginSign up
< BACK TO ALL REPORTS

Individuals are still being left out

Jason Goepfert
2020-07-31
The latest survey of individual investors by AAII showed a continued pattern of historically low optimism. The survey is skewed by an older population, perhaps not as taken by the rally in technology shares. Whatever the reason, it's a historic level of pessimism after such a massive rally in stocks.

We've touched on the AAII survey several times in recent months, noting how these investors were not buying into the rally. Far from it.

In the past, we've looked at the implied demographics of the survey, and it seems pretty clear that they skew heavily to the older end of the population. Maybe that's why a massive tech-led rally hasn't excited them as much as rallies in the past.

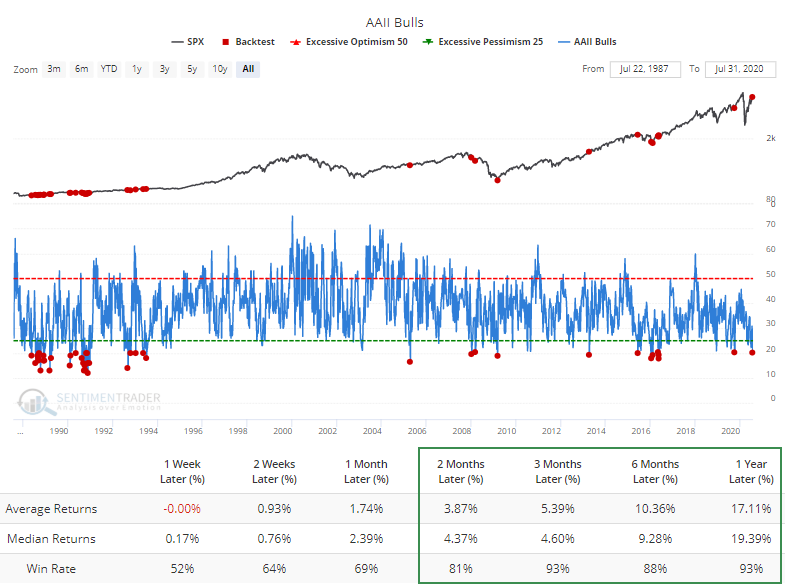
Whatever the reason, such a low level of optimism has rarely been to their benefit. The Backtest Engine shows that the S&P 500 has rallied 93% of the time over the next three months when fewer than 20.5% of respondents considered themselves bullish on the market.

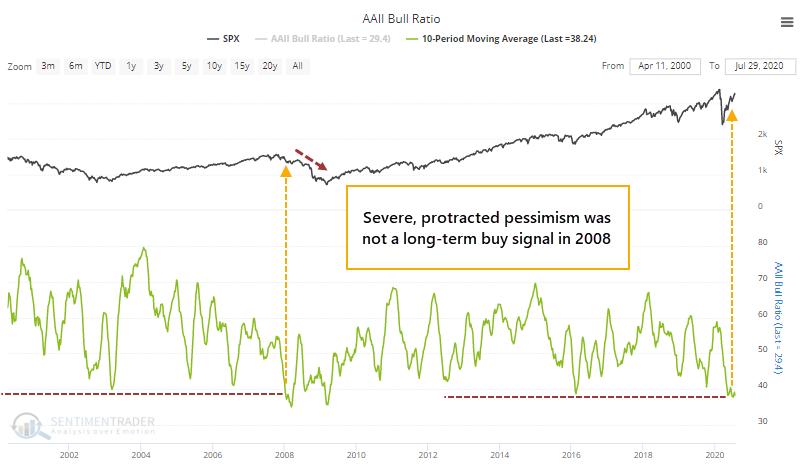
The biggest caveat about this data is that the last time these investors dropped to a decade-long bout of pessimism was in early 2008. While stocks bounced a bit in the shorter-term, it still preceded a loss of nearly 50% within the next year. 

What's even more curious about what these folks are saying is we've never seen a rally this large, over this long of a period, and still had so few investors consider themselves bullish.

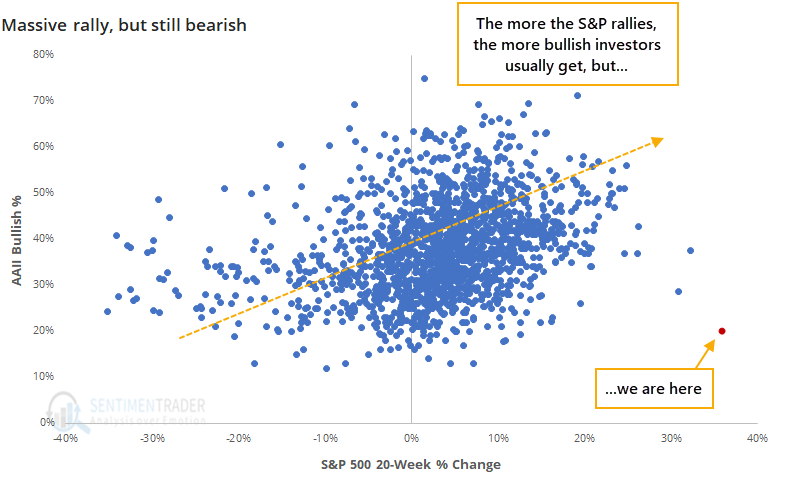
That red dot on the chart shows just how much of an outlier our current situation is. These investors have a strong tendency to become bullish after stocks rally, but they're clearly not doing so this year.

Historically, an unwillingness to buy into a big rally in stocks was a good sign for those rallies to continue.

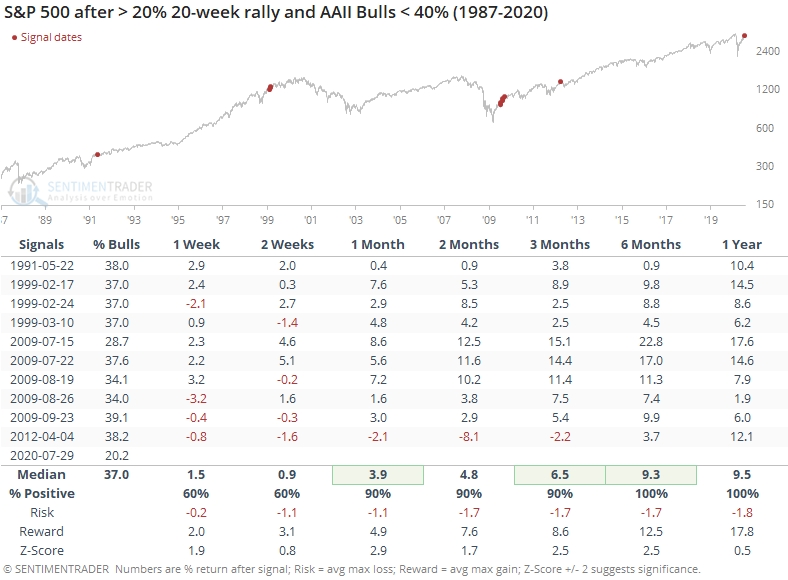
The last time this happened, in early 2012, the S&P faltered over the next couple of months. That was also the worst signal, by far. All of the others showed a gain from one month and beyond, with a ridiculously positive risk/reward ratio. Many of the signals were clustered in the summer of 2009, also the only time when consumers, in general, were also betting that stocks would decline.

This is not an easy time to define "sentiment". If we use some isolated surveys, equity fund flows, and moves in safe-haven assets, we could assert that investors are overly pessimistic and stocks should keep adding to their gains. But the weight of the evidence would suggest that far more indicators are showing the opposite, and during what is still a prove-it kind of market environment. None of these suggest much about what the next few days could hold, but they do continue to argue that over a medium-term (1-3 month) time frame, risk is high.

Sorry, you don't have access to this report

Upgrade your subscription plan to get access
Go to Dasboard
DATA &
TECHnologies
IndicatorEdge
‍
BackTestEdge
‍
Other Tools
‍
DataEdge API
RESEARCH
reports
Research Solution
‍
Reports Library
‍
actionable
Strategies
Trading Strategies
‍
Smart Stock Scanner
‍
FREE
RESOUrCES
Simple Backtest
Calculator
Simple Seasonality
Calculator
The Kelly Criterion
Calculator
Sentiment Geo Map
‍
Public Research Reports
‍
Free Webinar
COMPANY
‍
About
‍
Meet our Team
‍
In the News
‍
Testimonials
‍
Client Success Stories
Pricing
Bundle pricing
‍
Announcements
‍
FAQ
© 2024 Sundial Capital Research Inc. All rights reserved.
Setsail Marketing
TermsPrivacyAffiliate Program
Risk Disclosure: Futures and forex trading contains substantial risk and is not for every investor. An investor could potentially lose all or more than the initial investment. Risk capital is money that can be lost without jeopardizing ones’ financial security or life style. Only risk capital should be used for trading and only those with sufficient risk capital should consider trading. Past performance is not necessarily indicative of future results.

Hypothetical Performance Disclosure: Hypothetical performance results have many inherent limitations, some of which are described below. No representation is being made that any account will or is likely to achieve profits or losses similar to those shown; in fact, there are frequently sharp differences between hypothetical performance results and the actual results subsequently achieved by any particular trading program. One of the limitations of hypothetical performance results is that they are generally prepared with the benefit of hindsight. In addition, hypothetical trading does not involve financial risk, and no hypothetical trading record can completely account for the impact of financial risk of actual trading. for example, the ability to withstand losses or to adhere to a particular trading program in spite of trading losses are material points which can also adversely affect actual trading results. There are numerous other factors related to the markets in general or to the implementation of any specific trading program which cannot be fully accounted for in the preparation of hypothetical performance results and all which can adversely affect trading results.

Testimonial Disclosure: Testimonials appearing on this website may not be representative of other clients or customers and is not a guarantee of future performance or success.