
Indexes continue to mask inner turmoil

Major indexes, especially those heavy with tech stocks, are driving higher. Yet fewer stocks are coming along for the ride.
We already know how much influence the top 5 stocks are having on the broader indexes, with a record increase in their weighting over the past year. That masked some troubling participation problems a couple of weeks ago and continues to do so now.
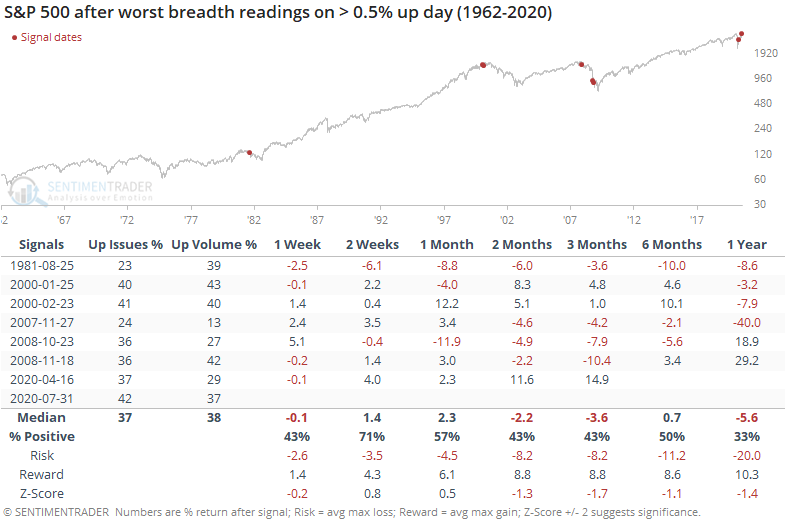
On Friday, the S&P gained more than 0.75% (again) and yet less than half of the securities on the NYSE managed to advance (again). Since 1962, there were only three other days that showed worse breadth for such a big up day on the index: 2007-11-27, 2008-10-23, and 2008-11-18. See the tables from the July 21 piece for more detail. This is something we usually see when small-cap stocks or rate-influenced stocks suffer large adverse moves. That doesn't make it any less notable.
Friday's session ranks among the worst-ever for Up Issues and Up Volume when the index gained 0.5% or more. There was a day in April that was even worse, but that was during a historically volatile period, with other days showing massive positive breadth thrusts and recoveries. We're in a dramatically different environment now.
On Friday, Troy noted the historically low participation on the Nasdaq despite the Composite Index's big gain. Divergences like this are tricky beasts - they can be very useful, but the time frame of their effectiveness varies, usually improved when there are clusters of days with odd readings.
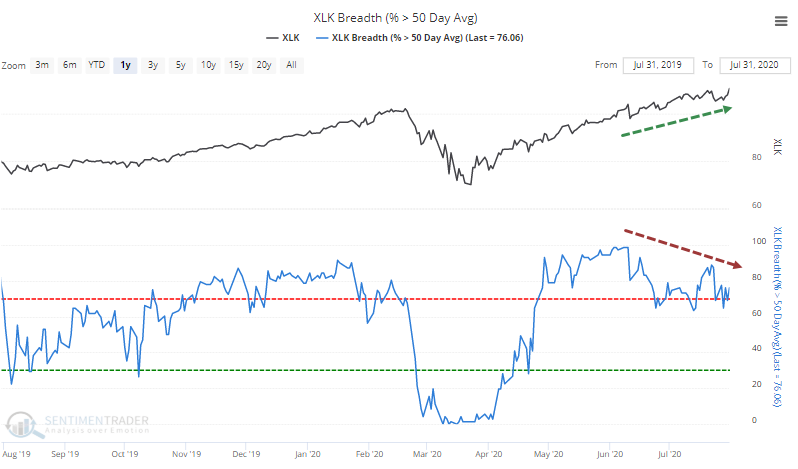
There are some signs that we're seeing this now on the Nasdaq. Despite a recent drive to new highs, fewer stocks have participated. There are divergences among stocks trading above their 50-Day Averages.
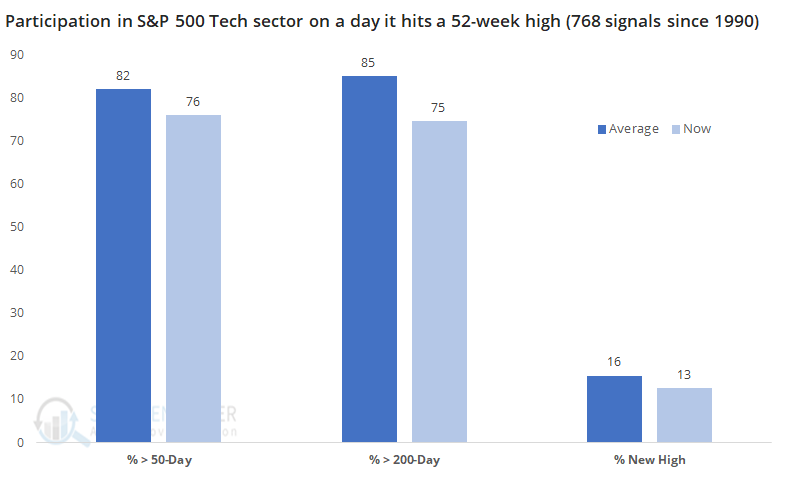
As well as relatively few reaching 52-week highs.
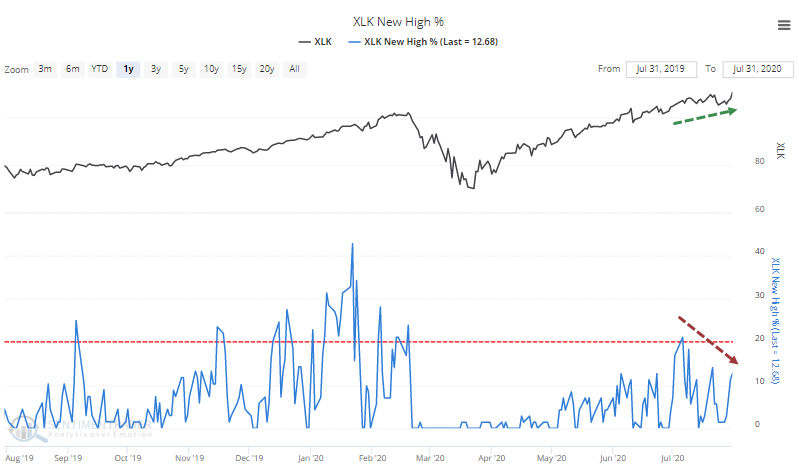
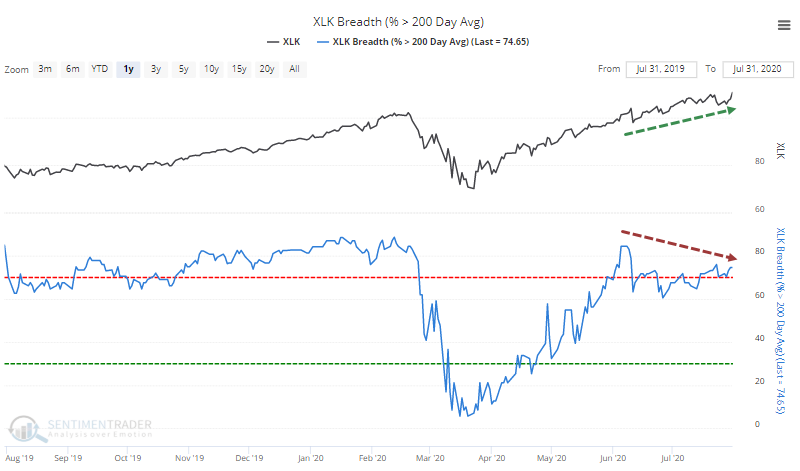
Since 1990, the S&P Tech sector has hit a 52-week high on 768 sessions. On those days, an average of 82% of stocks within the index closed above their 50-day moving averages. On Friday, only 76% of them did. That doesn't seem like a big difference, but it ranks in the bottom 25% of all readings. Same goes for the percentage trading above their 200-day averages. The percentage hitting a 52-week high was also abnormally low.
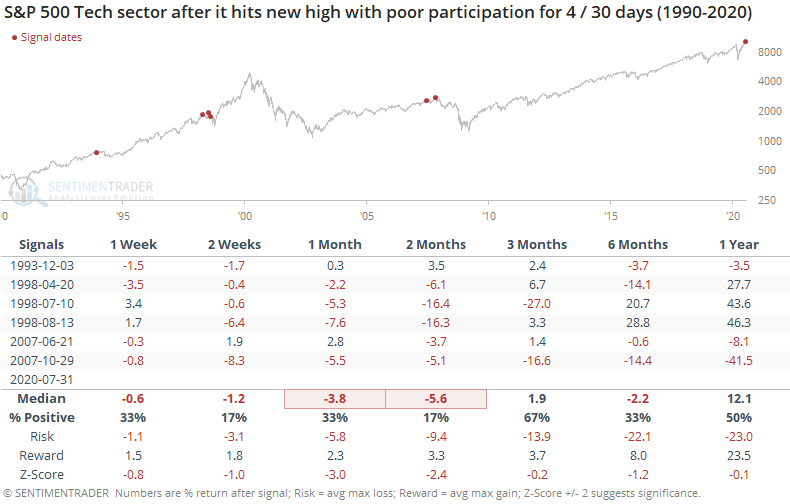
This isn't an isolated day. Something similar has happened three other times over the past 30 sessions, showing signs of being a cluster.
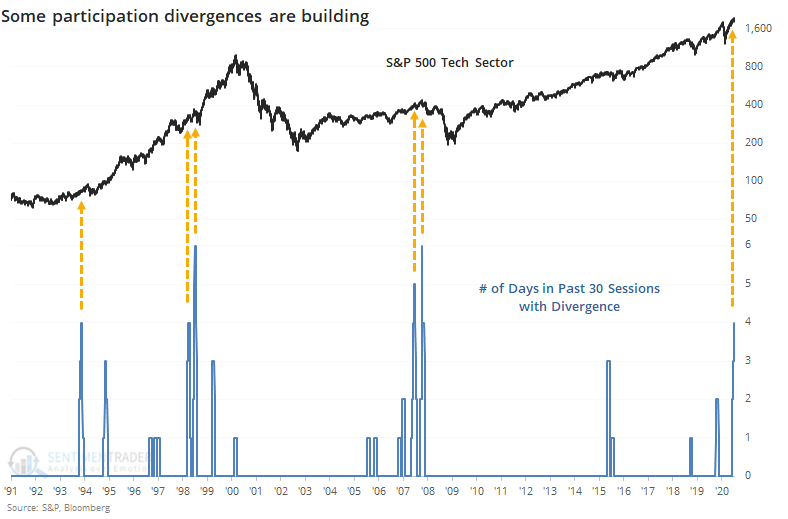
Generally, clusters of divergences are bad news.
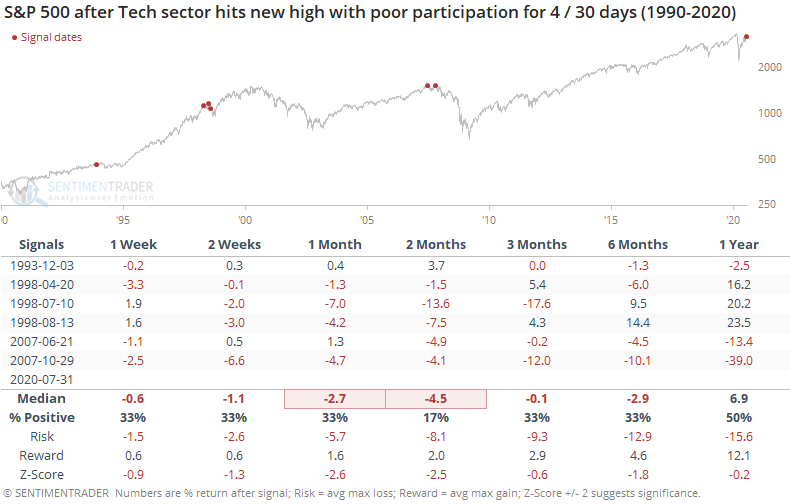
The broader S&P 500 index wasn't spared.
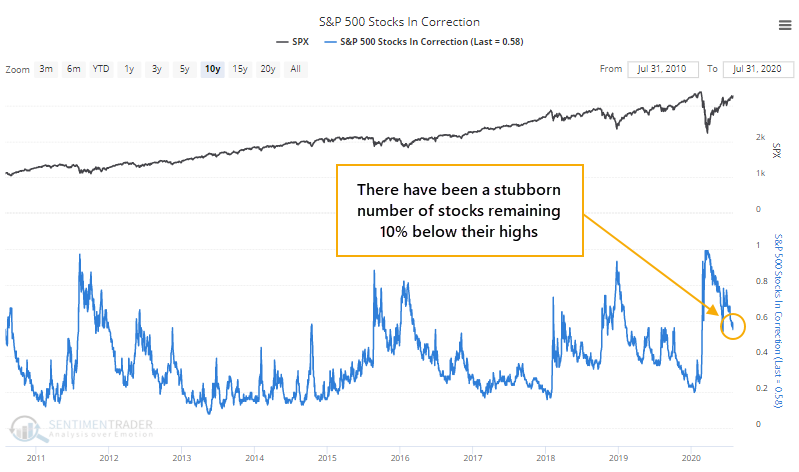
We're also seeing a stubborn number of stocks holding more than 10% below their 52-week highs. Healthy markets typically see fewer than 40% of stocks more than 10% below their highs, but this has been holding above 60%.
Even within the Nasdaq 100, more than a third of stocks are more than 10% below their highs. As of Friday, 80% of countries, 48% of industries, and 45% of sectors were 10% off their highs. All of those are very high for a time when indexes like the S&P 500 are within several percentage points of their own highs. The only days when this has happened in nearly 30 years was sporadically from 1998 - 2000.
You'll likely hear claims that breadth can't be bad because advance/decline lines are hitting new highs, which means everything is alright. Well, yes it is hitting new highs, but no it doesn't necessarily mean everything is copacetic. From a long-term point of view, 6-12 months, the extreme drop and then recovery in March - May bodes well for returns. From a shorter-term point of view, several weeks to several months, there are more worrying signs.