
Indexes across the world show the start of long-term recovery

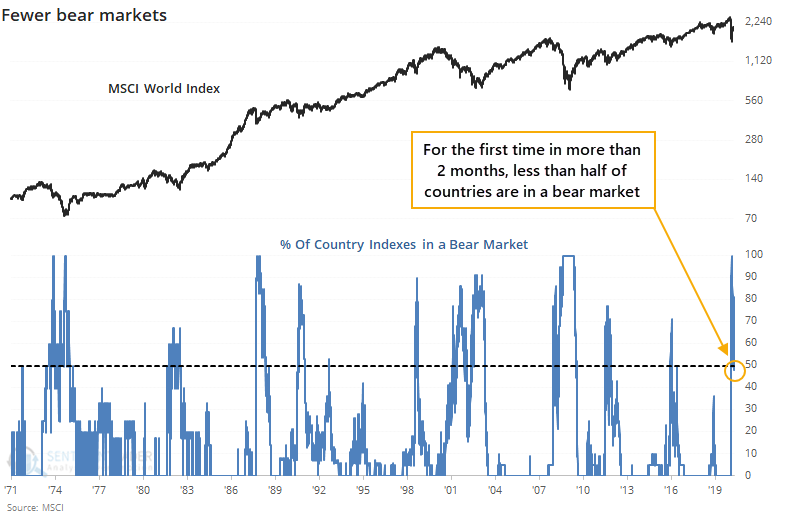
For the first time in months, less than half of major world equity indexes are in a bear market.
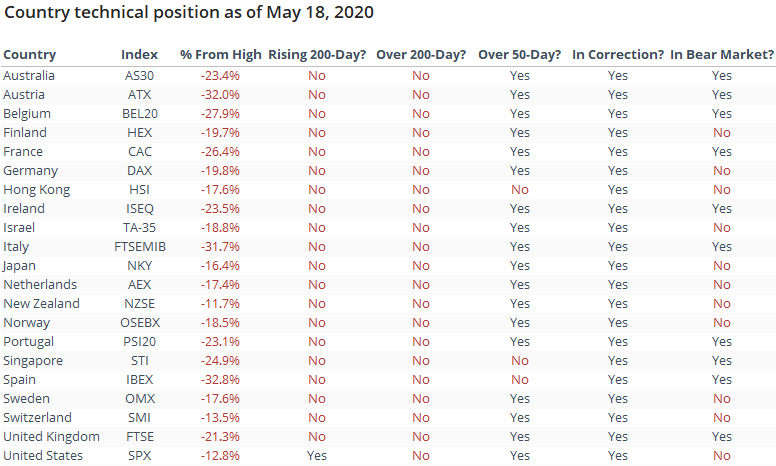
While some have an issue with semantics, by "bear market" we're using the simple definition that an index has to be trading at least 20% below its 52-week high. All of the indexes are still at least in a correction (more than 10% from their high).
We can see from the table below that the ones that have emerged from a bear market are mixed in terms of geography.
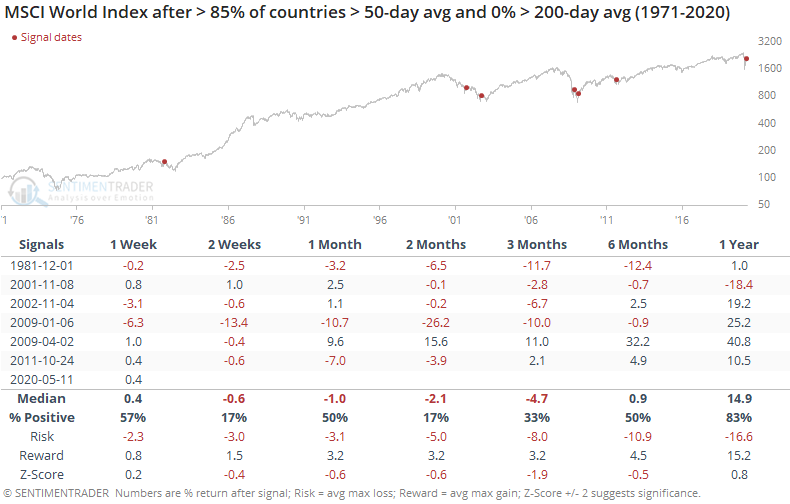
When more than half of the indexes recovered out of bear markets for the first time in months, it has been a mixed sign for the MSCI World Index.
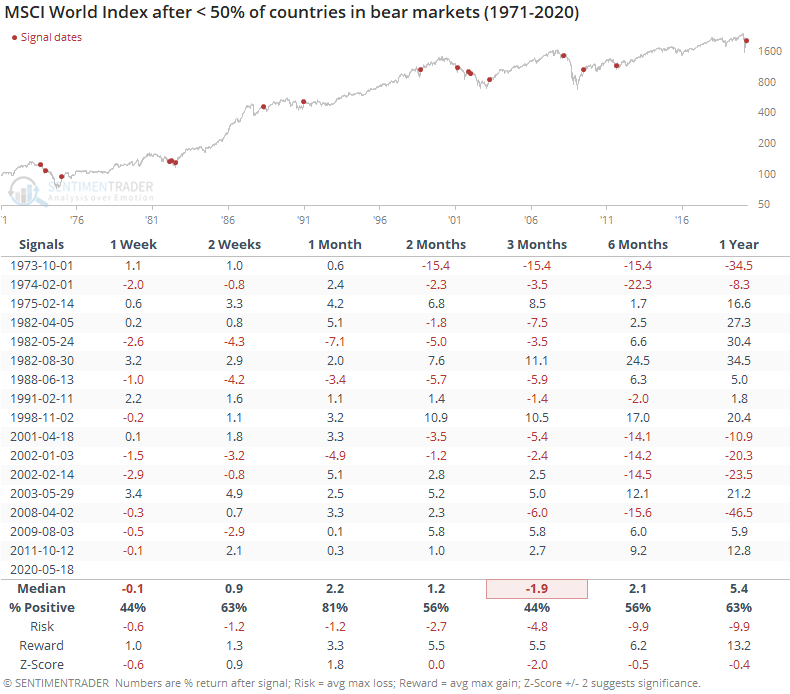
It proved to be a false start too many times to consider it a positive now. Most of the time, the successful signal was the 2nd or 3rd one after a protracted decline. Or even if there was only a single signal, the World Index didn't typically take off on a sustained rally right away. It showed a gain 81% of the time a month later, but only 44% of the time after three months.
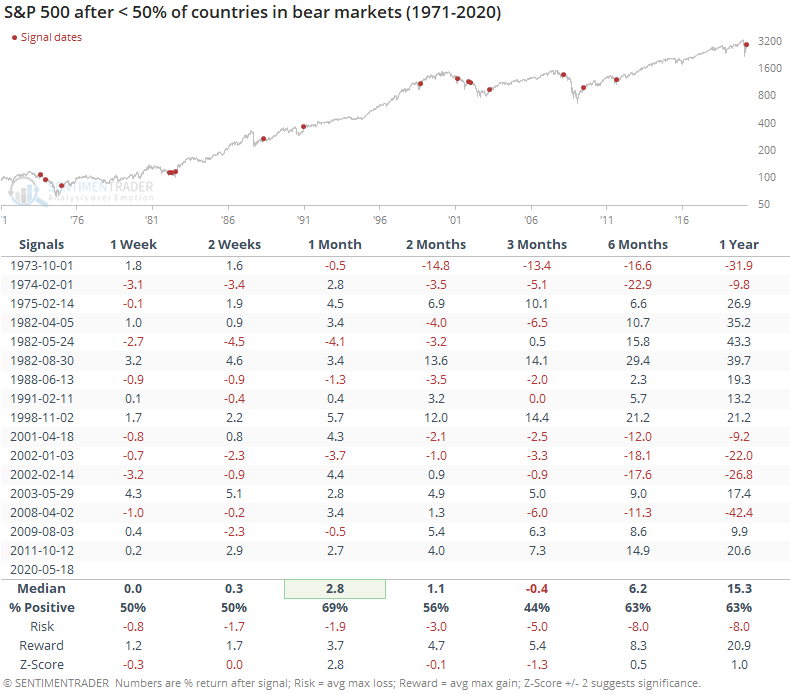
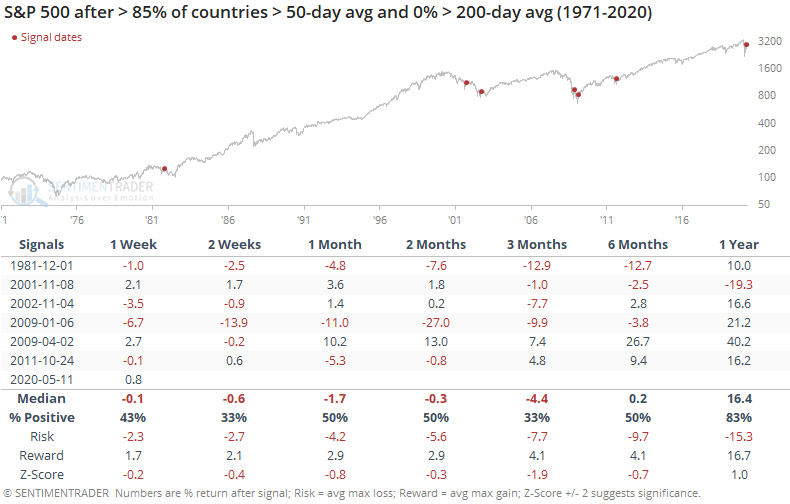
For the domestically inclined, it was a mixed signal for the S&P 500, too.
As part of the recovery, we're finally starting to see at least one index with a 200-day average that is rising. It's the first time in months that at least one country was seeing the nascent sign of the end of a long-term downtrend.
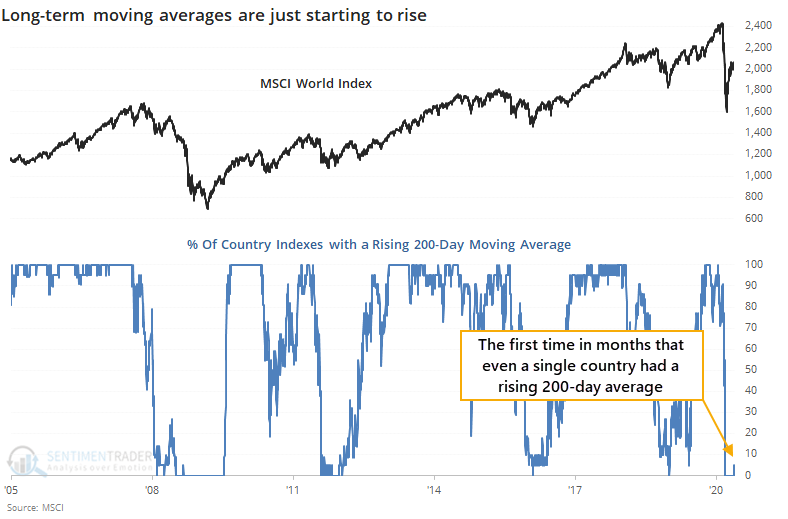
This was a much rarer signal, and mostly positive. It triggered at or near the ends of bear markets in 1982, 2003, 2009, and 2011 (if we consider that a bear market) and the only time it was false was in the summer of 2008.
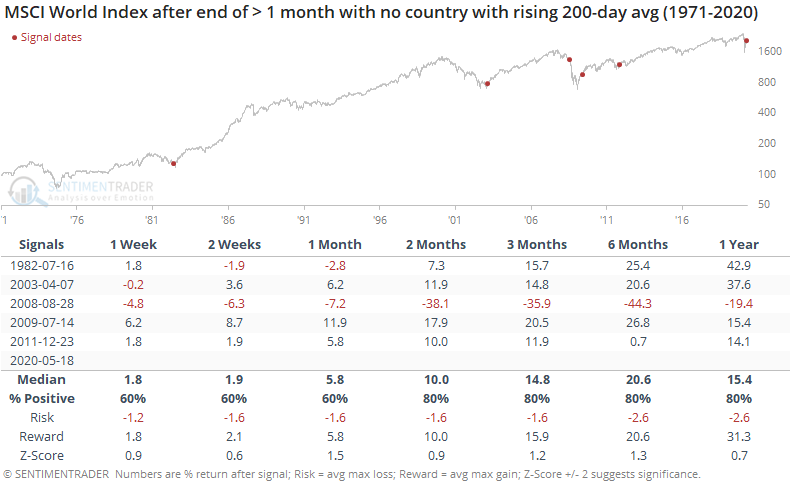
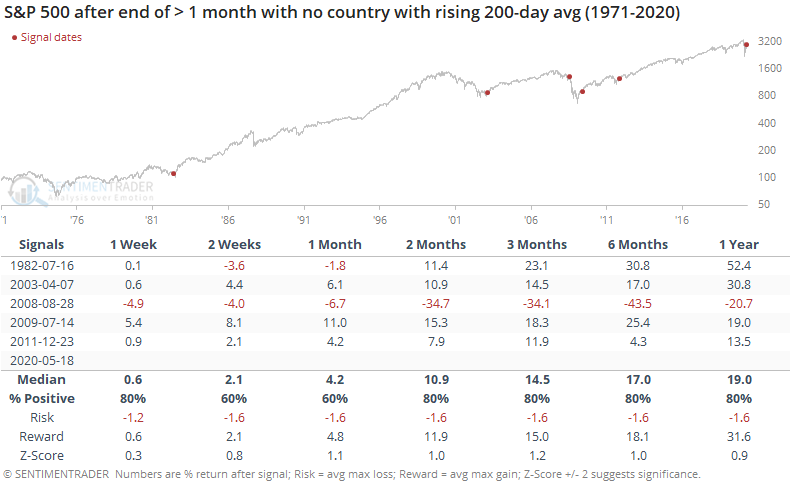
Returns for the S&P were good, too, with that same exception, of course.
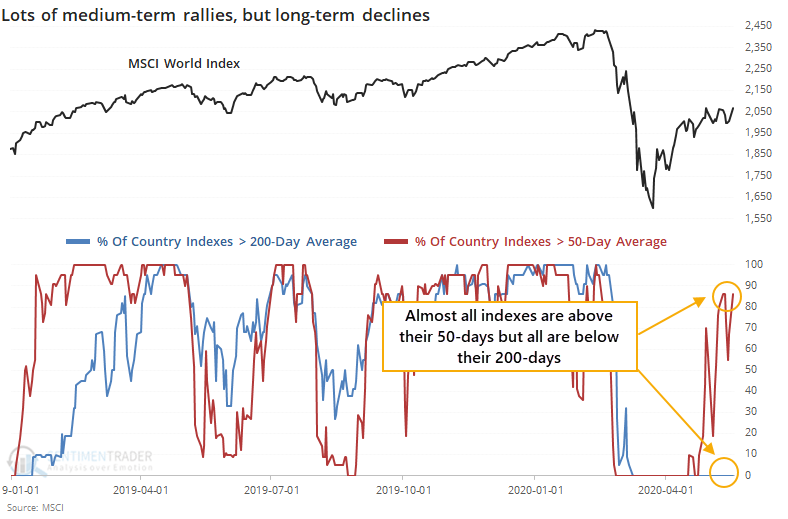
The recovery is happening very quickly on a medium-term basis. Almost all countries are once again above their 50-day moving averages, while below their 200-day averages.
After these initial surges, returns were poor. It first triggered a week ago.
Same for the S&P. All but one of the signals (in 2009) showed a negative return either two or three months later.
There is some mixed messaging here. Returns after a prolonged period with no indexes with a rising 200-day average were very good, but with a tiny sample size and a major exception. Returns after a surge in indexes above their 50-day averages were poor, but again a small sample. When half of the indexes first climbed out of bear market territory, returns were mixed but with an overall slight negative bias and poor risk/reward ratio.
There is a mostly negative medium-term bias to the data thanks to the surge in indexes above their medium-term averages so we'd give a modest edge to the downside in the coming months. But the longer-term recoveries have mostly impressive precedents and would more strongly suggest that it's a positive over a 12-month+ time frame.
From the country table above, we can see that the S&P 500 is the only index that has a rising 200-day average. For the first time in more than two months, the average showed a higher value than the day before.
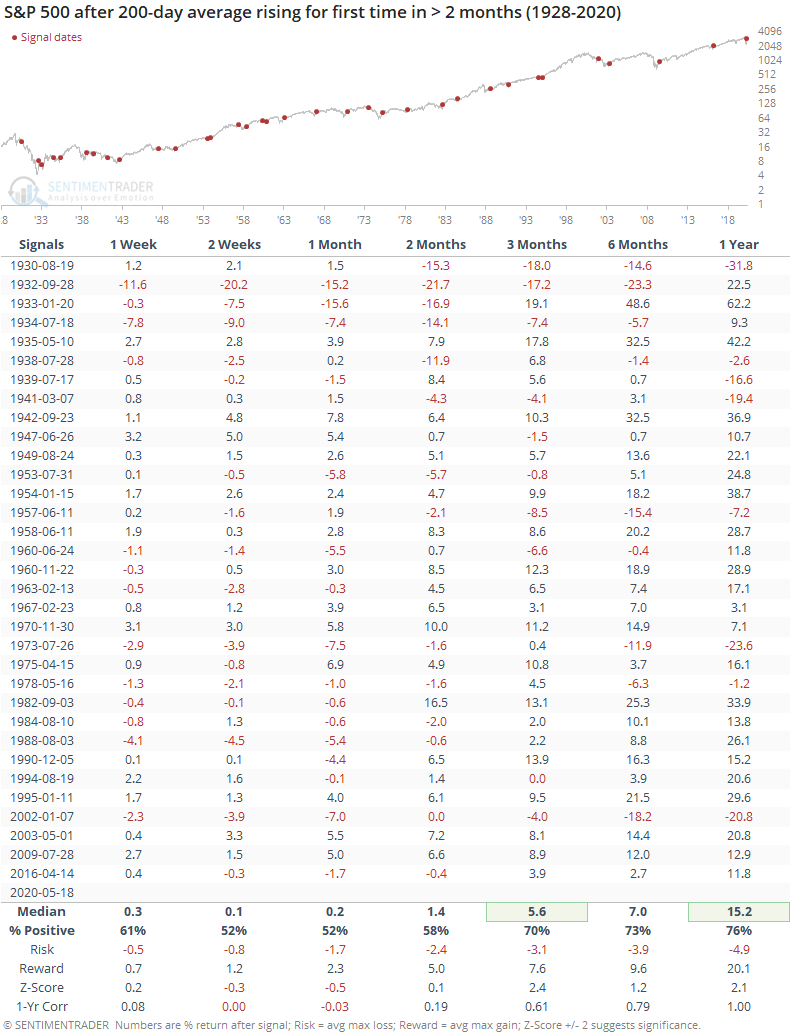
This was a mixed sign over the shorter-term, and got progressively more positive, with a good risk/reward ratio over the next year.
With some of these studies, we can get a sense of whether a signal might be successful or not depending on how investors react in the shorter-term, but that wasn't such a good guide here. The "1-Yr Corr" row is the correlation between the median return over that time frame and the median return a year later. For example, the S&P's return over the next two weeks had a 0.00 correlation to its return over the next year. It can't any more edgeless than that.
Similar to countries around the world, stocks just within the S&P 500 have seen a surge in the number of them that have climbed above their 50-day averages yet remain below their 200-days.
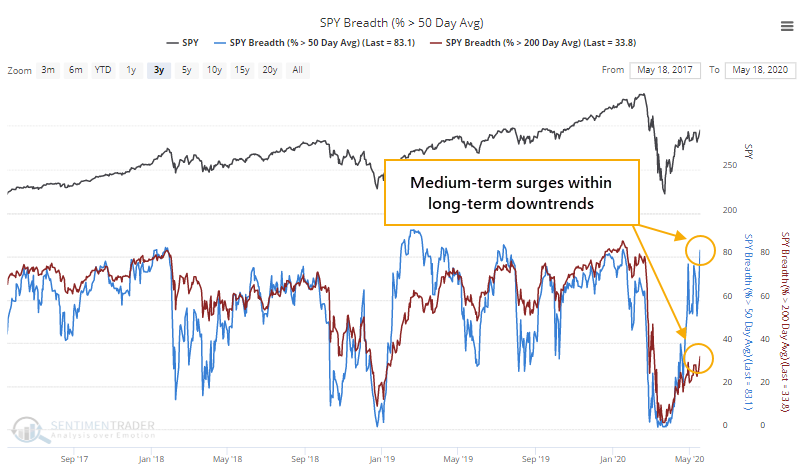
To this kind of degree, it has only happened three other times.
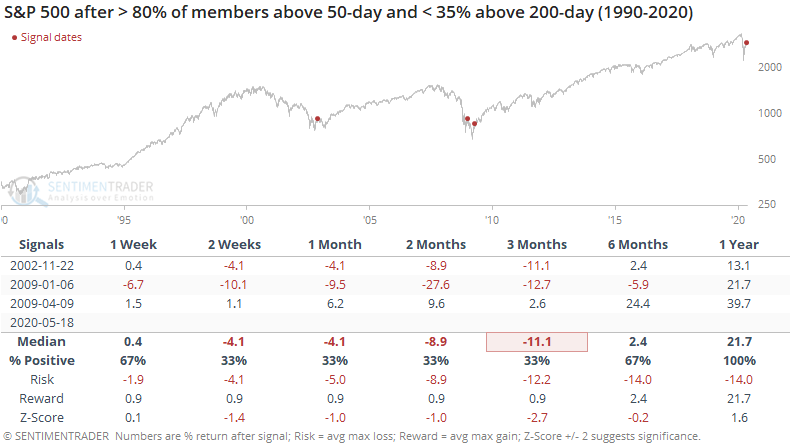
The first two were the initial signs of bottoming action after protracted bear markets, which saw prices fall back down to test or exceed the initial low. The last, in April 2009, indicated a lasting bottom.
It should be a good sign that some of these long-term measures are starting to show signs of progress, within the S&P and across major indexes. It's just going to take time for that positivity to play out, given a relatively strong tendency to see digestion over a medium-term time frame after surges like this.